
ビズグラム(ビジネスモデル図解)
-

-
ビズグラム(ビジネスモデル図解)とはなにか?
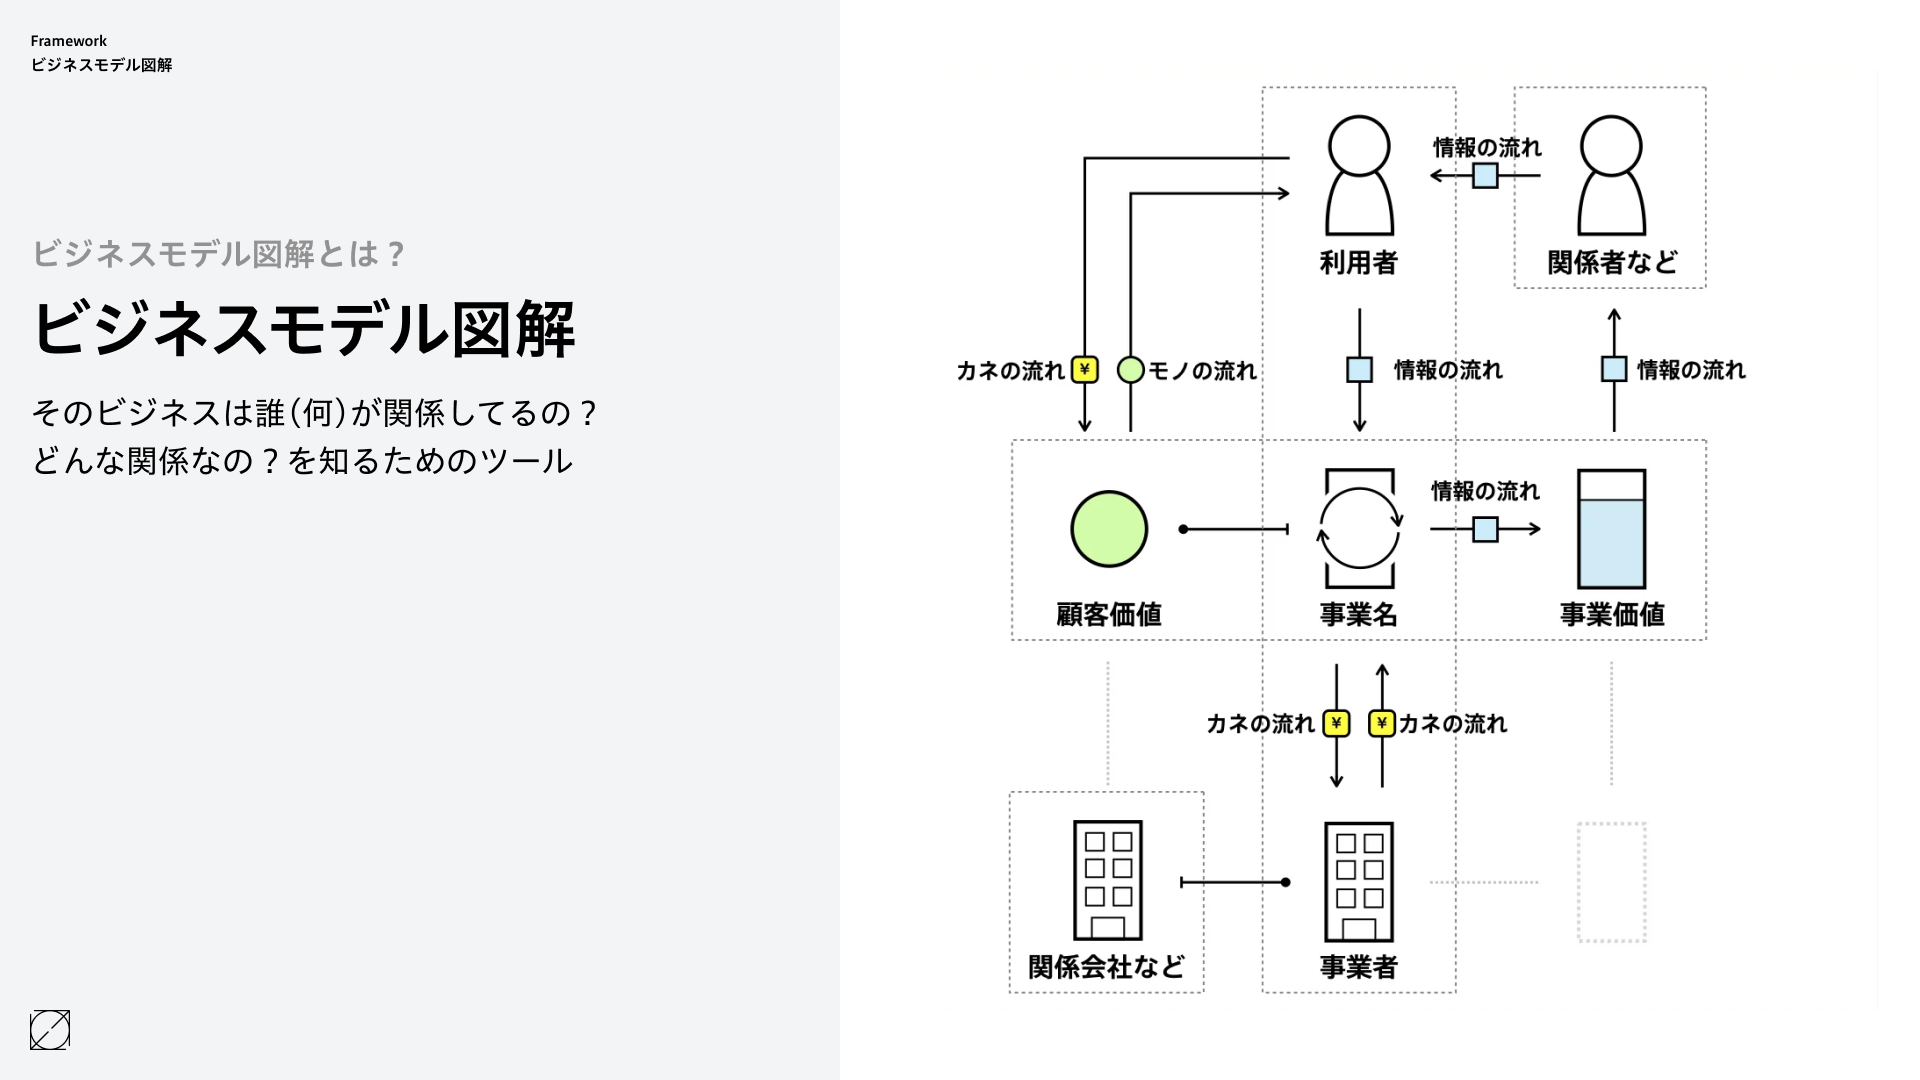
ビズグラム(ビジネスモデル図解)とは、ある企業のサービスの事業者や利用者がどう関わりお金が循環するのかを表現している図です。そのビジネスがどのように経済合理性を実現しているのか、そのビジネスの特徴は何かが一目で分かります。
ビズグラムを使うことで、自社のビジネスを可視化するだけでなく、自社の経営資源や強みを把握したり、投資家や経営陣に対する説明資料としても活用することができます。
Bizgram User Manual
-
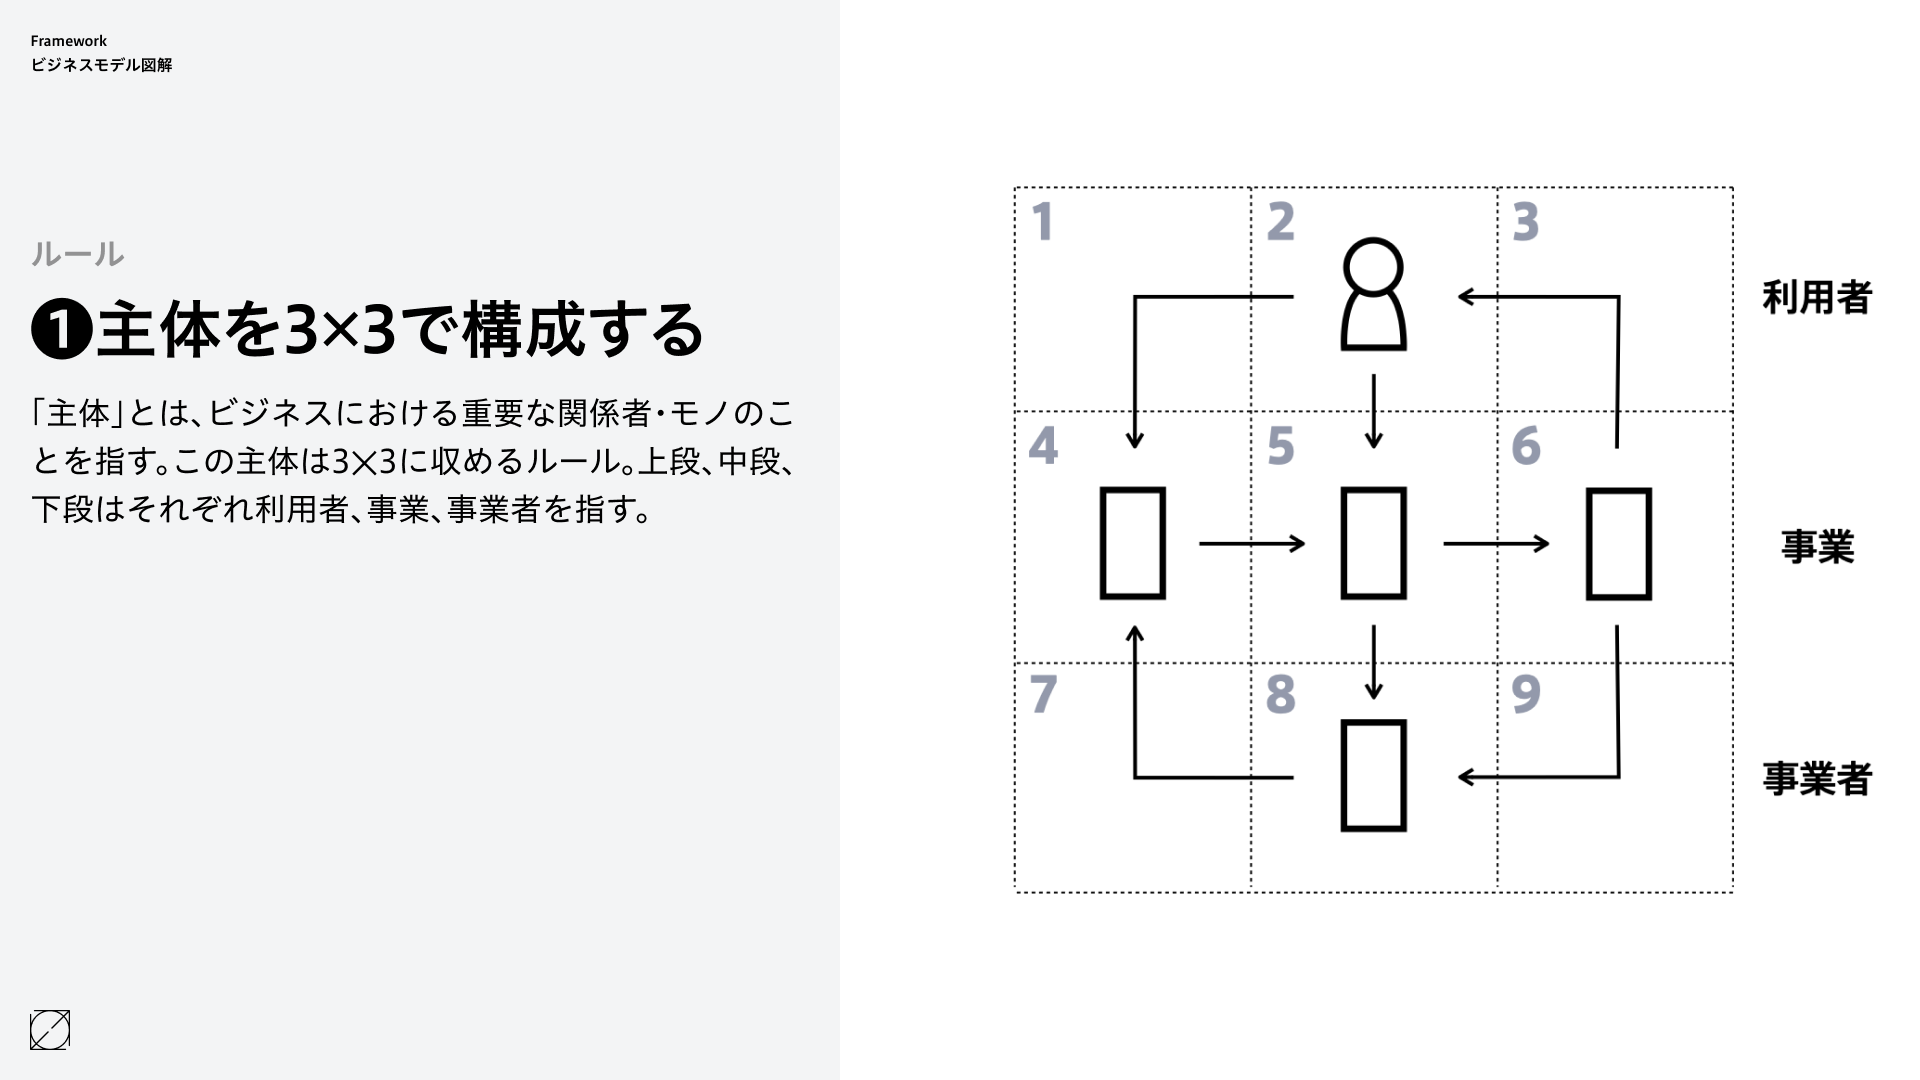
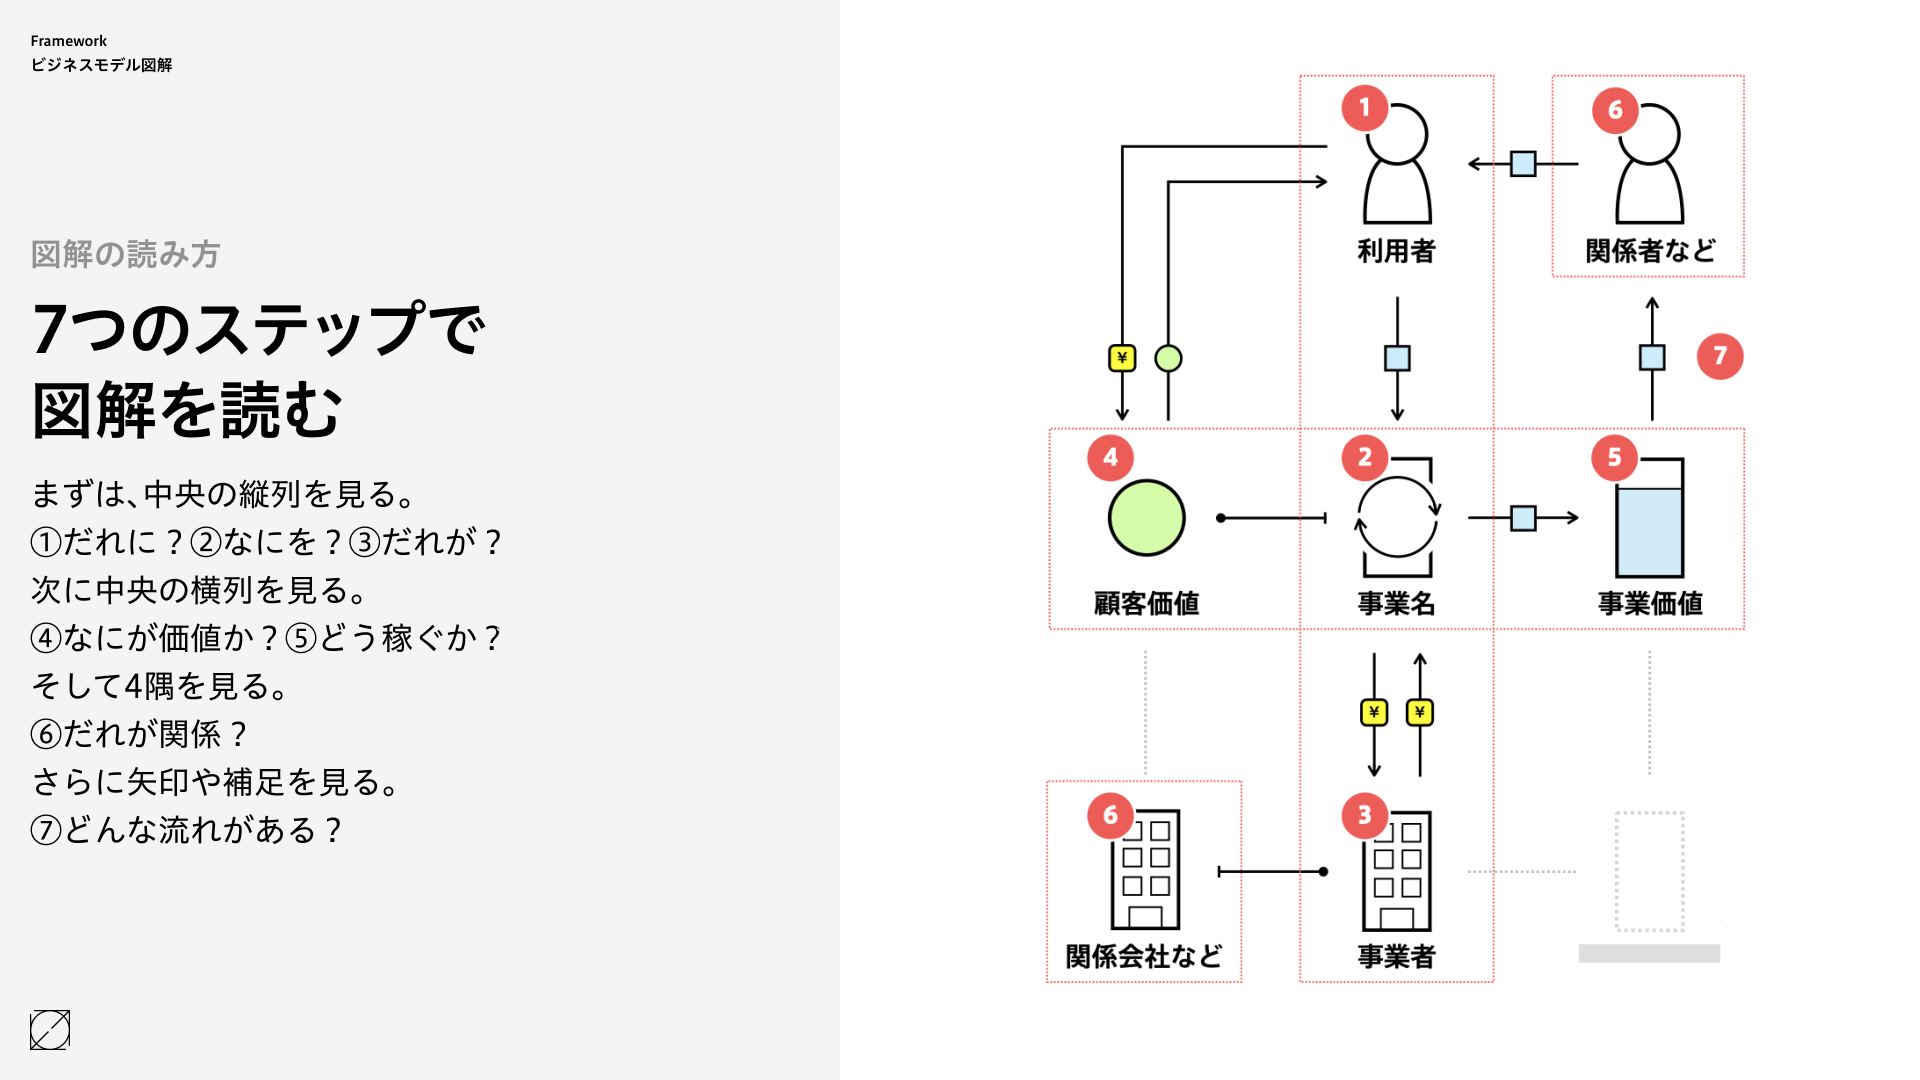
- Entities (important stakeholders and things in a business) are placed in a 3x3 grid.
-
- The top row represents users, the middle row represents businesses, and the bottom row represents operators.
-
- First, look at the vertical column in the center and confirm: 1) For whom is the business being carried out? 2) What is the business being carried out? 3) Who is carrying out which business?
-
- Next, look at the center row and confirm ④What are users paying for? ⑤How are businesses circulating their money?
-
- Then, look at the four corners and check ⑥Are there any partner companies or important related companies?
-
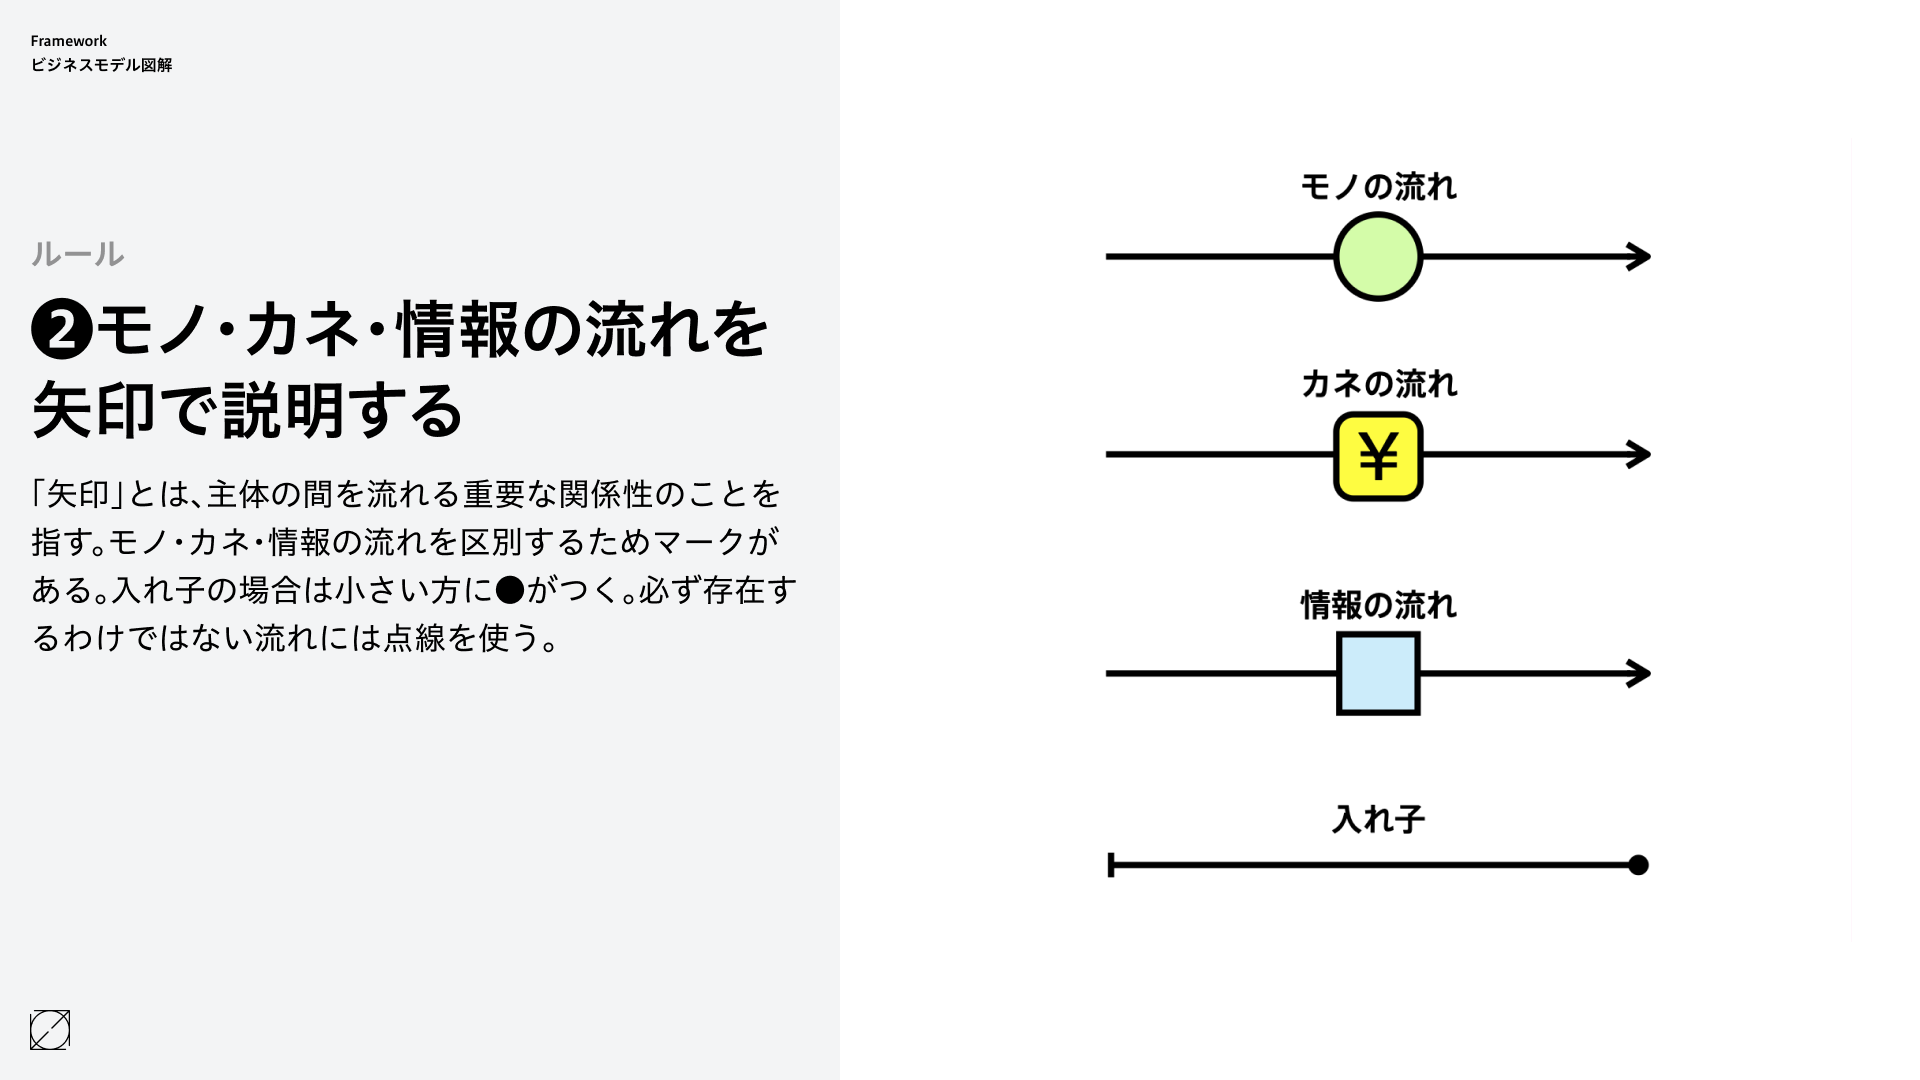
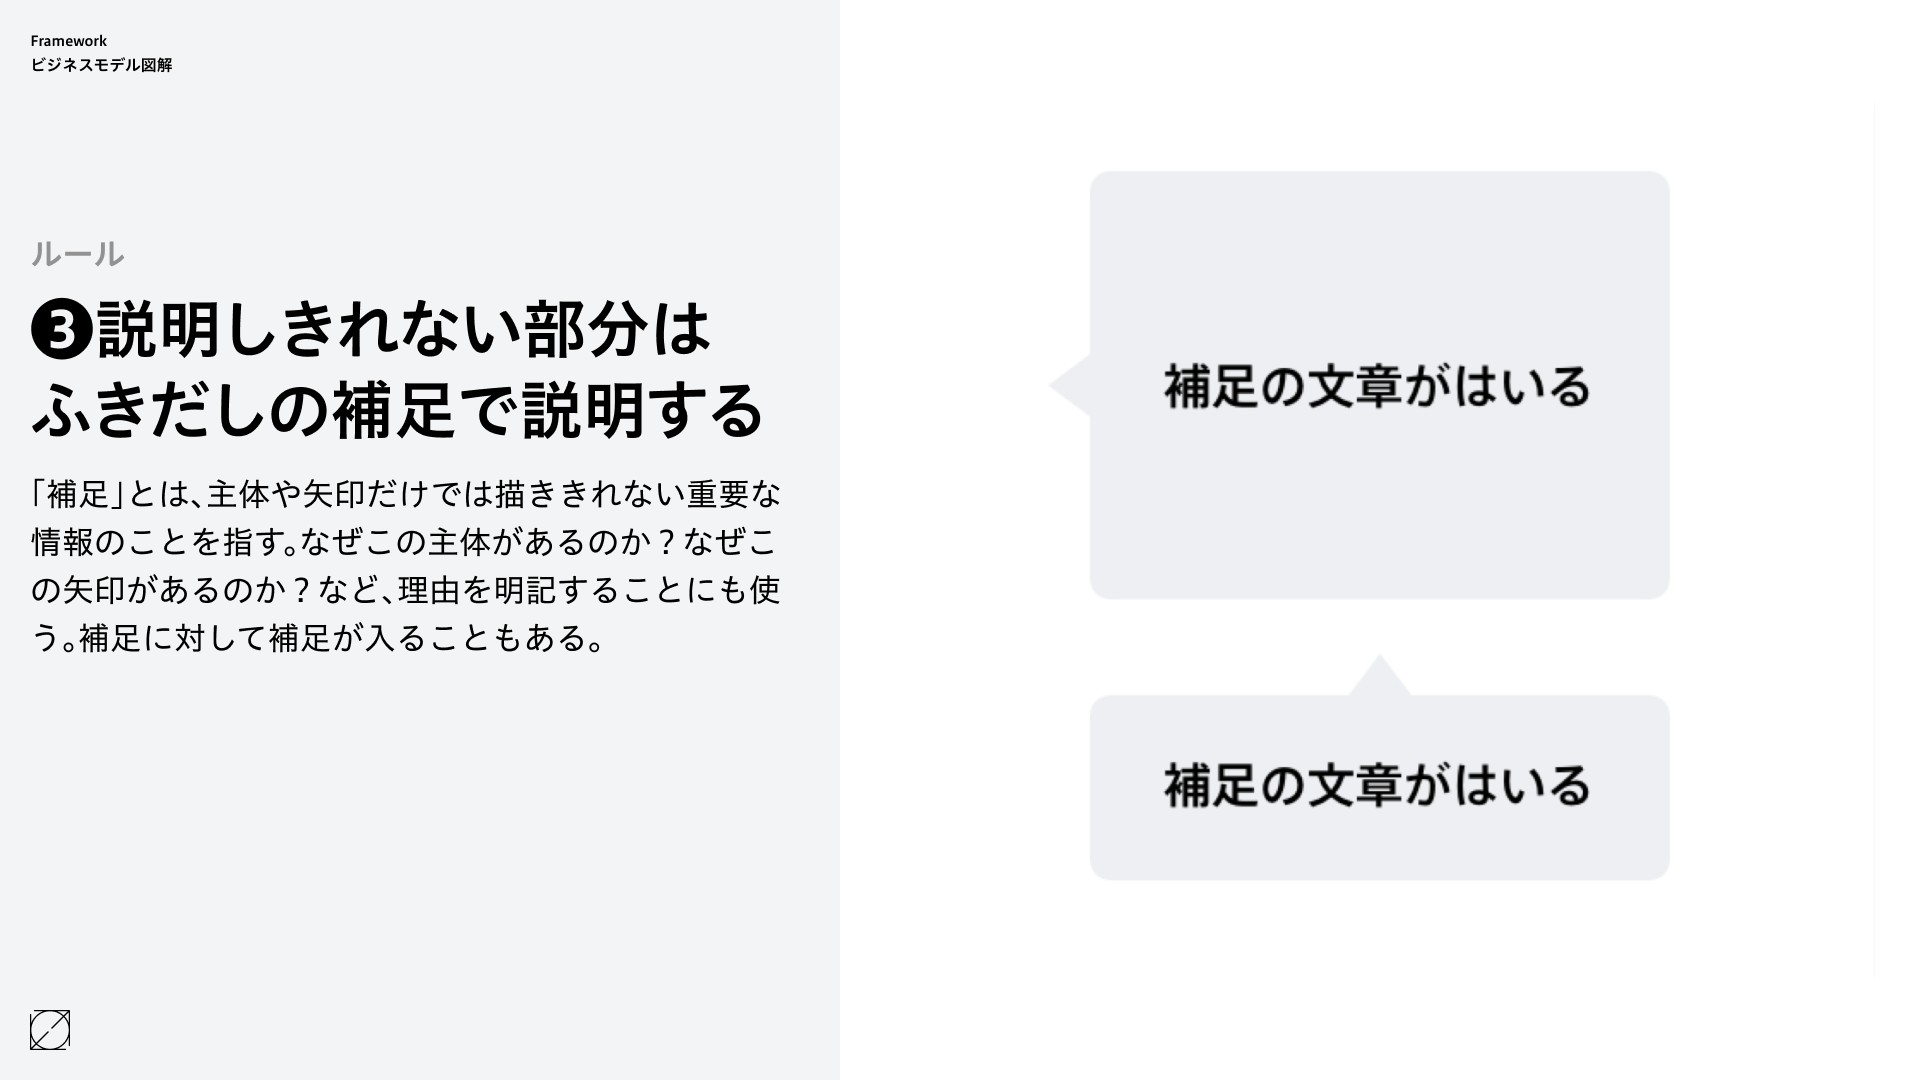
- Finally, look at the arrows and supplementary notes to see how things, money, and information flow.
BizGram book
-

-
Business Model 3.0 Compendium
"Business Model 3.0" is a book that introduces next-generation business models incorporating co-creation and adaptability, in addition to economic viability, social impact, and creativity. It systematically explains the mechanisms of evolving businesses that grow sustainably while addressing societal challenges, using examples and illustrations. This book, in an illustrated encyclopedia format, allows readers to learn about the business structures required in the coming era.

-

-
Business Model 2.0 Illustrated
This book visualizes the profit structures and uniqueness of various businesses in a common diagram. By visualizing businesses in different genres and industries in a common diagram format, it becomes possible to compare them and see the characteristics and appeal of each business. 100 unique cases from a variety of genres and industries both in Japan and overseas have been carefully selected and illustrated. By reading and interpreting the abundant examples through diagrams, you are sure to find something that will provide you with hints for the business you are involved in.

-

-
How to create diagrams that explain business mechanisms
This book compiles and explains the know-how for creating Bizgrams (business model diagrams). While "Business Model 2.0 Encyclopedia" presented 100 case studies, it didn't delve much into the specifics of creating these diagrams. This book, on the other hand, comprehensively covers the key points and注意事项 to consider when actually drawing these diagrams. Why not try using Bizgrams when brainstorming business ideas or analyzing existing businesses?


-
Bizgram All-in-one Set
Regular price From ¥5,500Regular priceUnit price per -
BizGram Toolkit
Regular price From ¥1,650Regular priceUnit price per -
Business Model Diagram Toolkit
Regular price From ¥1,650Regular priceUnit price per -
Business Model Diagram Sheet
Regular price From ¥2,475Regular priceUnit price per -
Business Model Diagram Toolkit (ENG)
Regular price ¥1,650Regular priceUnit price per


ビズグラムができるまで
ビジネスモデルは常に新しくアジャイルにアップデートされていくもの。この激動の時代の中、その傾向が、ますます強くなってきていると思います。
しかし一方で、ビジネスモデルはなかなかオープンにならない情報も多く、一同に集まることもなく、透明性が高いとは言いにくい状況です。これだけビジネスモデルの変革や転換が求められている中、ビジネスモデルの情報には辿り着きにくい、情報の非対称性があると思います。
もちろん、秘匿性の高い技術的な情報や、コアな経営資源もあると思いますが、どんな儲け方をしていて、それはステークホルダーを犠牲にしたものではないか、など、ビジネスモデルを表に明示していくことで社会に対して説明責任を果たしていく方法もあるかと思います。
そんな問題を解決するために、ビジネスモデルをヒト、モノ、カネ、情報の4つに分類し、さまざまな企業やサービスの利益構造、独自性を、3x3の9マスに「図解」で見える化しました。
また、図解方法をまとめた「ビジネスモデル2.0図鑑」を2018年9月にKADOKAWAより出版し、大きな反響を得ています。
「ビジネスモデル2.0図鑑」の販売発行部数は国内10万部を超え、海外(中国、台湾、韓国)でも発売されています。また、ビジネスモデルの図解を誰でも作成できるように、ツールキットをWeb上で公開しており、そのダウンロード数は30,000回以上、多くの企業や団体でこの図解方法が活用されています。ビジネスモデルと検索すると検索上位に関連記事が表示され、作成した関連記事は合計で150万アクセスを超えています。2019年には、GOOD DESIGN AWARDを受賞しました。
内閣府や日本経済新聞社など、企業や官庁でビジネスモデルを発想するためのツールとして講演やワークショップも行っています。また、主に起業家教育として、高校や大学向けの授業も行いました。
