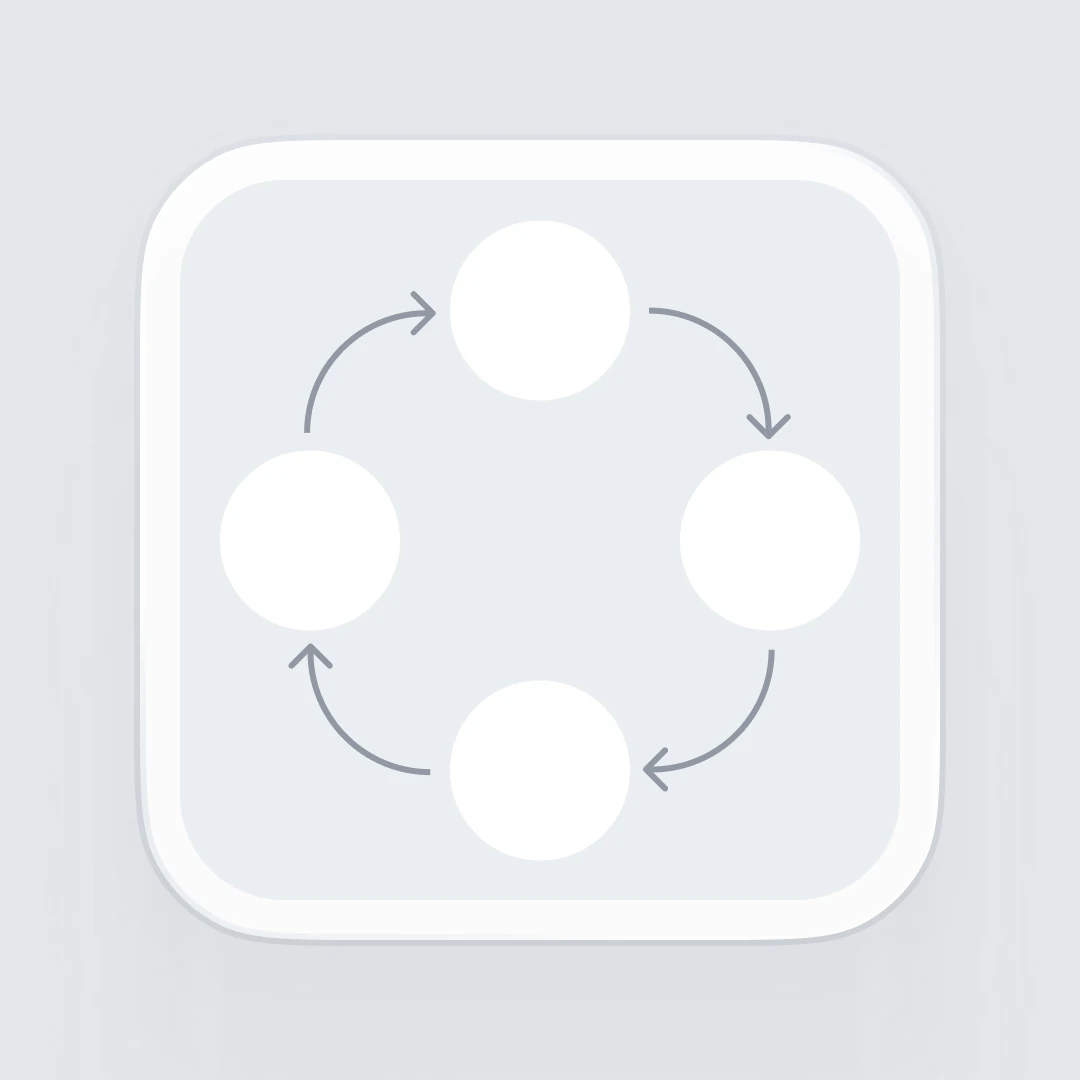
Issue Map
A map that visualizes the whole picture of an issue to find the path to an essential solution.
What is the Issue Map?
The Issue Map is a map that visualizes the complex issues surrounding a particular field and their structure. You start by writing out everything that is currently an issue in that field to make it visible, then connect their cause-and-effect relationships to organize what affects what and how, and what the essential issues are—turning the whole picture into a single map. Using the Issue Map, you can determine how issues should be solved within the overall system, and take the first step toward charting a path to a solution.
How the Issue Map works
What is an Issue Map?
Issue Map
A diagram in which people in different positions bring out the issues of a region or an organisation together, then link them by cause and effect on a single sheet.
Issues affect one another: one issue creates another, which in turn makes the first one worse. Acting on each issue separately without seeing these links tends to treat only the symptoms.
How to read it
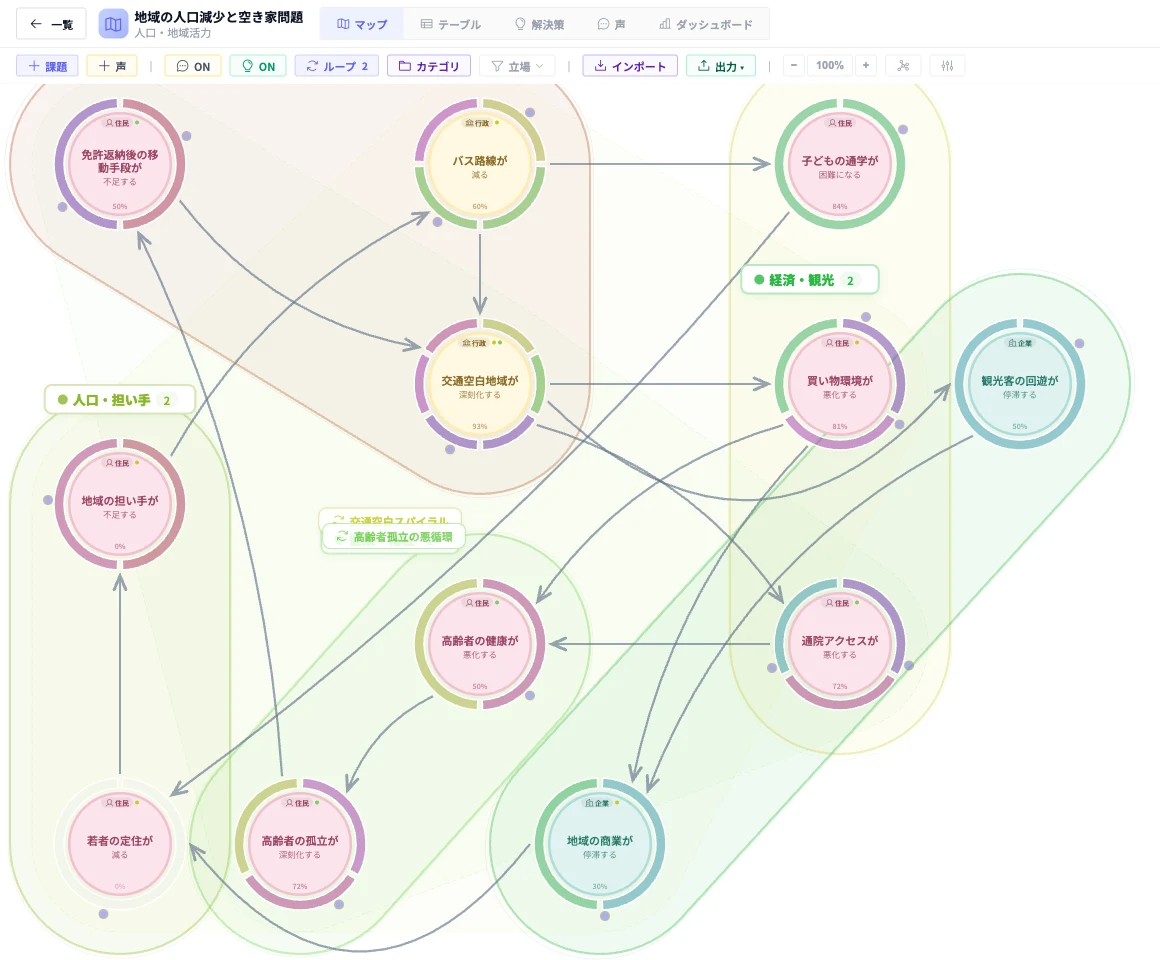
Each item is an issue, each arrow means "A, therefore B"
Each item on the map is an issue. Each arrow points from the issue that causes to the issue that results.
Following the arrows shows where issues that used to be discussed separately come from and what they lead to. An issue where many arrows meet is the cause or the result of many others.
An example of an issue map about getting around locally, put together from issues in several regions’ maps. The colour of each circle shows the position of the people who raised it. How to read it
Arrows that form a loop keep making things worse
A chain of arrows that leads back to where it started is called a loop. Where there is a loop, the situation gets worse just by being left alone.
Once a loop is visible, the discussion turns to where to break it. A meeting that was about bus timetables widens to car dependence and how people in the area meet.
One of the loops found in the same issue map. How to read it
Every issue has someone who raises it
Each issue carries the position of the people who raise it, such as residents, government or businesses. Filtering by position shows whose issues are missing from the map.
Those who are not in the room are often the people most affected. When a gap shows on the map, that viewpoint can be put on the agenda.
How to read it
Voices and actions are tied to issues
Voices gathered on the ground are tied to the issue they support, so you can trace later why that issue matters.
Actions agreed in discussion are tied to the issues they are meant to address, so the map shows where you are trying to intervene.
How it is used
Kept up to date, not finished once
An issue map is used in a form that the people involved can open and add to. Next year's discussion can start from last year's map.
We make them the same way in any field: local transport, home medical care, nursing care, how an NPO runs, and decisions on impact investment.
Who uses it
- local government and company staff working on regional or social issues
- secretariats sorting out issues that involve many parties
- impact funds and financial institutions that invest in solving social issues
Write out every issue in a field, link them by cause and effect, and the whole picture of what affects what fits on one map. When we mapped a region's issues, we went to the region, listened to the people involved, and built it from there. It is not made once and finished: the people involved in the theme use it to line up their views, and rewrite it each time the issue itself moves. The same format is published as the tool Kadai.
Use it as an app
KadaiSee the structure of issues. Gather voices, plan solutions, track progress
Kadai maps how the issues a region or an organization faces connect to one another. Work through "What is causing this?" and "Where can we act so that the fix spreads?" on a diagram of issues linked by arrows. From gathering voices on the ground to planning solutions and tracking progress, it all happens in one tool.
Try Kadai ↗Related projects
 Community Drive Project
 Kadai
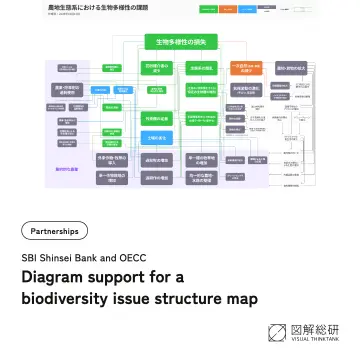 Diagram support for a biodiversity issue structure map
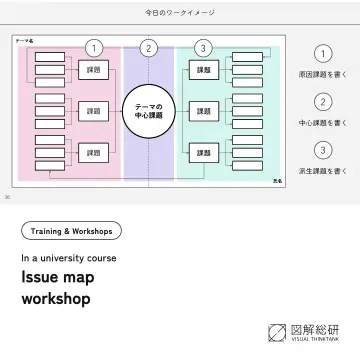 Issue map workshops in a university design thinking course
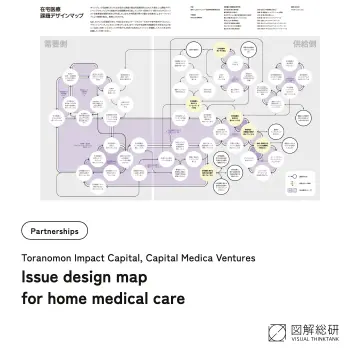 Issue design map for home medical care
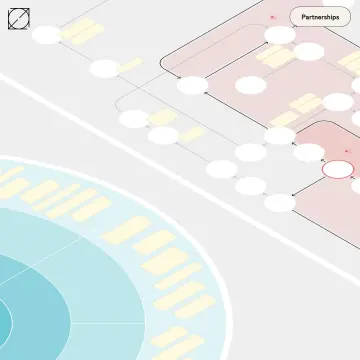 Working alongside an organization to map its bottlenecks
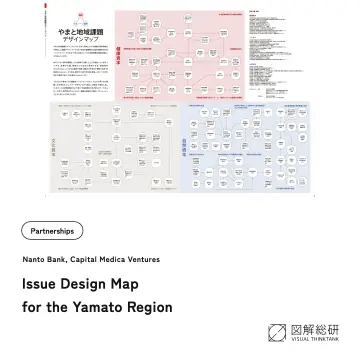 Issue design map for the Yamato region
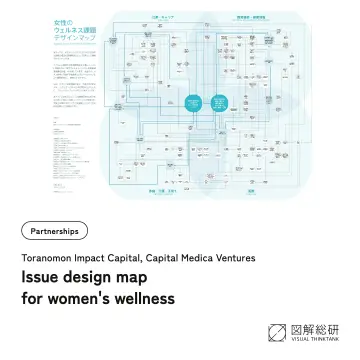 Issue design map for women's wellness
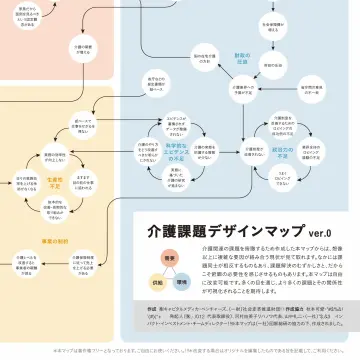 Issue design map for caregiving
How the Issue Map Was Born
The Issue Map has so far illustrated the structure of issues—organizing their cause-and-effect relationships—in areas where multiple issues intertwine to form one large social problem, such as the issues of nursing care, women's wellness, and specific regional issues.
These diagrams are created on request; ZUKAI has helped with planning and facilitating workshops and with producing the diagrams. For example, in an effort to visualize regional issues, we actually traveled to the region, listened to the people involved, and built the diagram through repeated research.
The Issue Map is not something you make once and are done with—it keeps changing. But by visualizing issues and making them open in this way, we hope it lays the groundwork, even a little, for discussions toward solving issues, and is used as a communication tool.
News about this framework
 Interview published in the NewsPicks series "The Future Drawn by Places and Communities"News2026/08/20
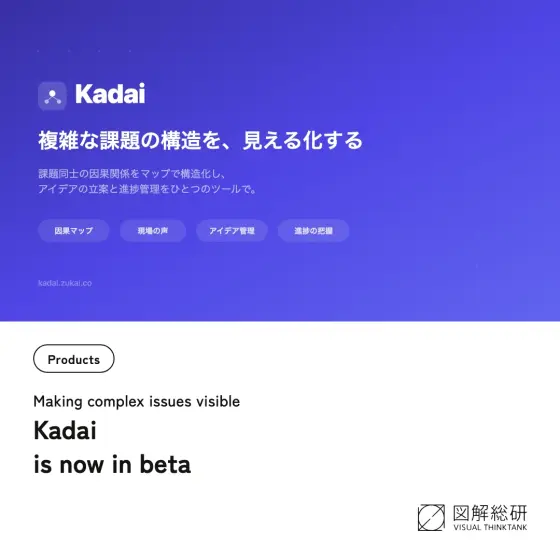 We've released Kadai, a web service for visualizing issues, in betaNews2026/04/08
 The Community Drive Project has been covered by NikkeiNews2025/07/09
 A contributed article on the Community Drive Project has appeared in the February 2025 issue of "Kensetsu Management Gijutsu"News2025/02/07
Contact
A problem you are stuck on, a project you are considering, a press inquiry. We also take inquiries that have not taken shape yet.
Talk to us