Common Languages
A common language is a tool that organizes and structures information about a specific theme (a concept, a social issue, and so on) using a shared format—lowering the barrier to understanding it while reducing the cost of communicating with others. Below is a list of the common languages ZUKAI has created so far.
List of common languages
Bizgram
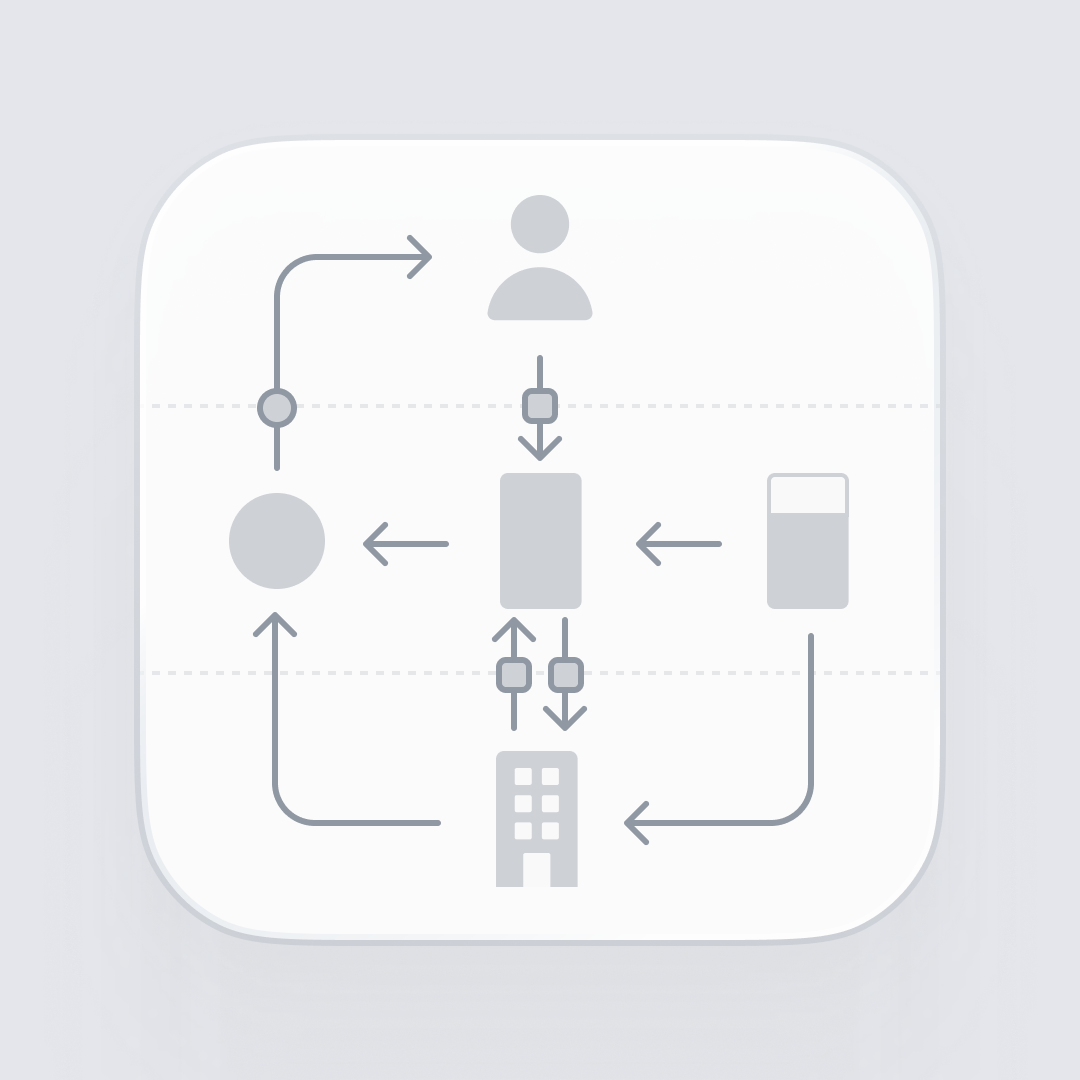
A diagram that maps the profit structure and uniqueness of various companies and services onto a 3×3 grid of nine cells.
Bizgram (business model diagram) expresses how the providers and users of a company's service relate to one another and how money circulates. It shows at a glance how a business achieves economic rationality and what makes it distinctive. Using Bizgram, you can not only visualize your own business but also grasp your management resources and strengths, and use it as explanatory material for investors and management.
Accounting Map

A single diagram that structures accounting concepts and terms so anyone can share a common understanding of accounting.
The Accounting Map conveys 15 accounting terms (revenue, expenses, profit, P/L, assets, liabilities, net assets, B/S, cash, cash flow, the three financial statements, market capitalization, goodwill, PBR, and ROE) in a single diagram. With the Accounting Map, you can understand the flow of money in a company and how it affects society. You can also visualize a company's cash flows and, by comparing it with competitors, make its strengths and weaknesses visible.
Purpose Model

A blueprint for co-creation that organizes the shared purpose and roles of multiple stakeholders.
The Purpose Model is a “blueprint for purpose-centered co-creation projects” that lets diverse stakeholders act together. With the project's purpose (shared goal) at the center, the related stakeholders are arranged around it, visualizing who participates in the project, in what role, and for what reason. Using the Purpose Model, in projects that aim to create social value rather than just profit, you can put the purpose into words in order to share it with others, and check whether the stakeholders who have gathered are heading in the same direction.
Strategy Map

A map that gives an overview of the frequently used frameworks—from corporate strategy to business models—and how they relate.
The Strategy Map gives an overview of the sequence of 11 management strategies and frameworks that are useful to consider when a company creates a business—flowing all the way from corporate strategy down to the business model. Because it also includes the “questions” for thinking through strategy, it clarifies which frameworks you should be considering and makes it easier to build a strategy. Using the Strategy Map, you can fill in missing perspectives—such as grasping where you currently stand or identifying a business's bottlenecks—when creating new businesses or analyzing existing ones.
Issue Map

A map that visualizes the whole picture of an issue to find the path to an essential solution.
The Issue Map is a map that visualizes the complex issues surrounding a particular field and their structure. You start by writing out everything that is currently an issue in that field to make it visible, then connect their cause-and-effect relationships to organize what affects what and how, and what the essential issues are—turning the whole picture into a single map. Using the Issue Map, you can determine how issues should be solved within the overall system, and take the first step toward charting a path to a solution.
Policy Model
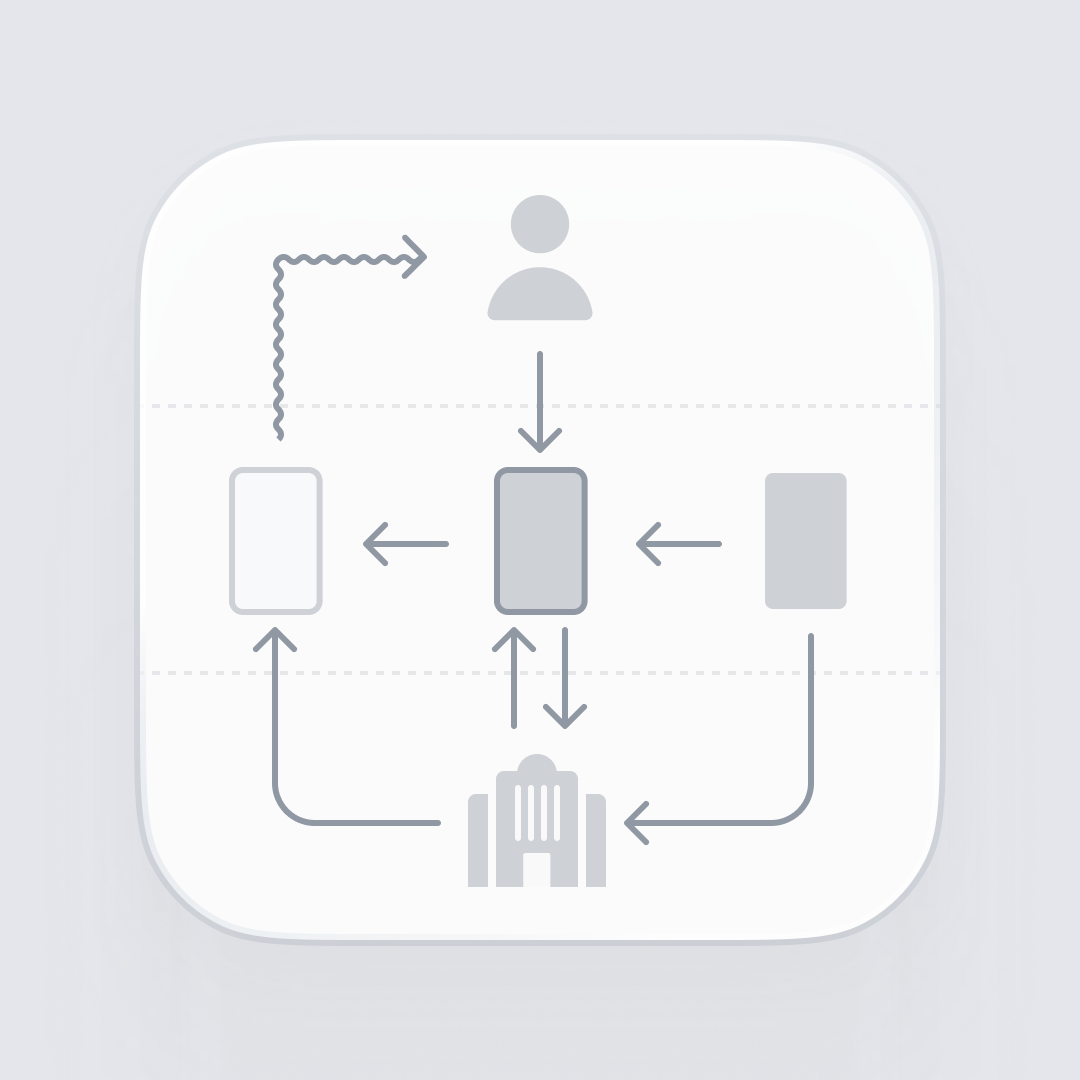
A framework that expresses the means and goals of policies and systems simply, on a 3×3 grid of nine cells.
The Policy Model is a tool that organizes and visualizes various systems, laws, and subsidies related to policy using a 3×3 grid of nine cells. You can grasp the outline of a policy: “for whom,” “by whom,” “for what purpose,” and “by what means” it is carried out. Using the Policy Model, people in local governments or organizations trying to devise a particular policy or system can put into words the overall picture of the stakeholders, goals, and means involved, and illustrate it in an easy-to-understand way.
Environmental Issues Map

A structured visualization of complex, hard-to-grasp environmental issues using a shared format.
The Environmental Issues Map structurally visualizes the main stakeholders of environmental problems and their connections. It first addresses the structure of problems common to environmental issues, and then takes up specific problems: “pollution,” “climate change,” and “resource issues.” Using the Environmental Issues Map, you can better understand the essence of environmental problems and intuitively grasp how they relate to us. This diagram was created in collaboration with the National Institute for Environmental Studies (NIES).
Want to create a common language together?
ZUKAI also conducts joint research to create new common languages like the ones above. Common languages can be applied in many places. Please feel free to get in touch.
Contact
If you have any questions or would like to discuss a project, please feel free to get in touch. Click the “Contact us” button below to open the inquiry form.