Bizgram
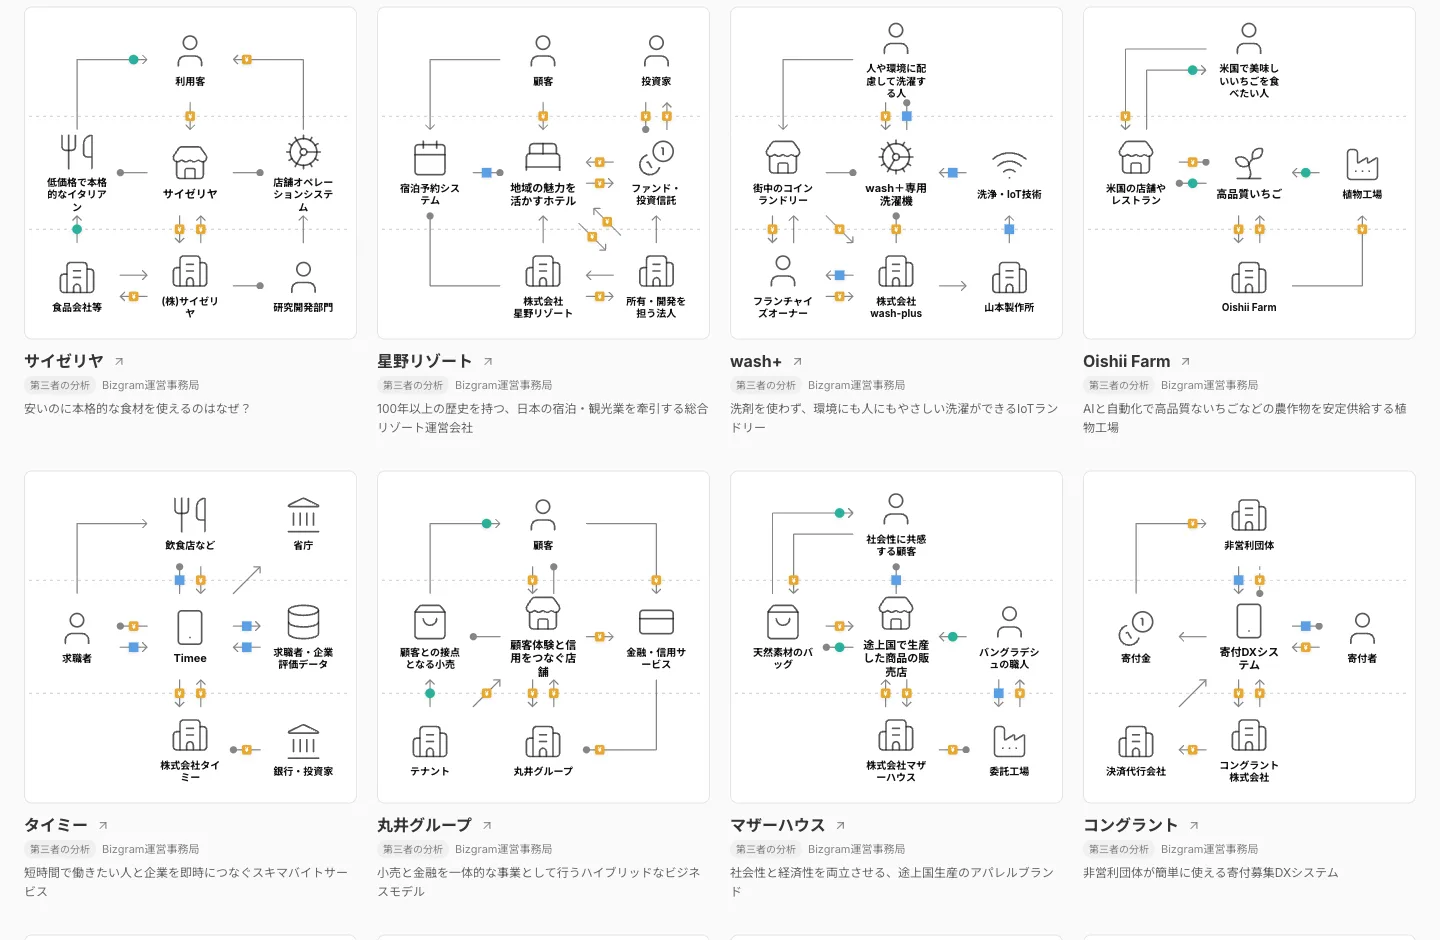
A diagram that maps the profit structure and uniqueness of various companies and services onto a 3×3 grid of nine cells.
What is Bizgram?
Bizgram (business model diagram) expresses how the providers and users of a company's service relate to one another and how money circulates. It shows at a glance how a business achieves economic rationality and what makes it distinctive. Using Bizgram, you can not only visualize your own business but also grasp your management resources and strengths, and use it as explanatory material for investors and management.
How Bizgram works
What is Bizgram?
Bizgram
A business model diagram. A tool for seeing who (or what) is involved in a business, and how they relate to each other.
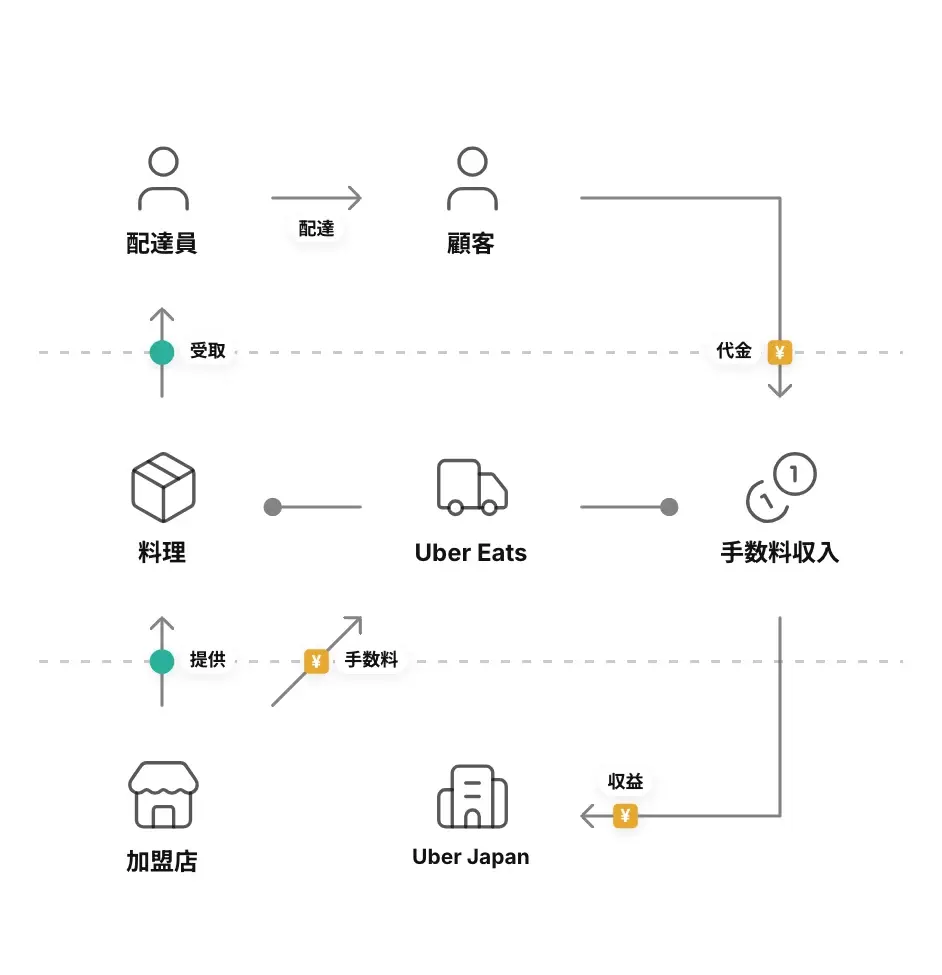
The diagrams here are Uber Eats, drawn in the Bizgram app. The app labels them in Japanese.
Rule
1. Place the players on a 3×3 grid
Players are the people and things that matter in a business. They always fit on a 3×3 grid. The top row is the users, the middle row is the business, and the bottom row is the operator.
Rule
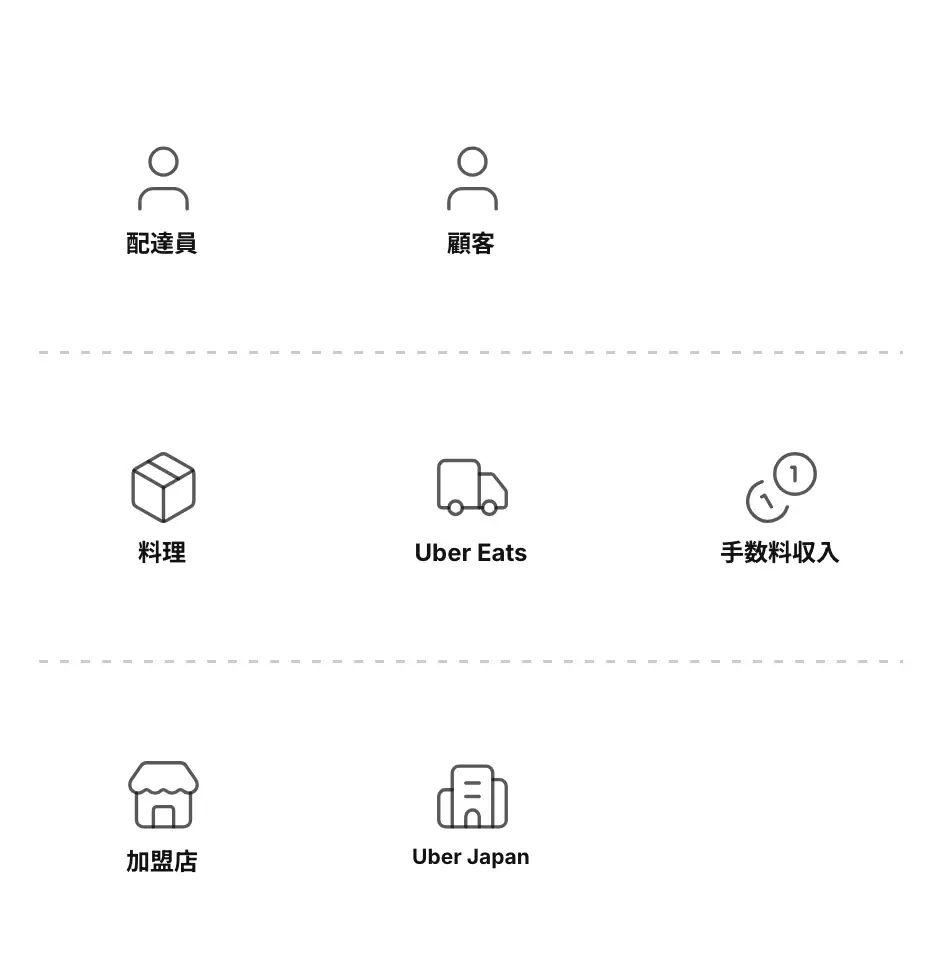
2. Show flows of goods, money and information with arrows
Arrows show the important relationships between players. A mark on each arrow tells you whether goods, money or information is flowing. When one player contains another, the smaller one gets a dot. A dashed line is a flow that may not always exist.
Rule
3. Explain the rest in notes
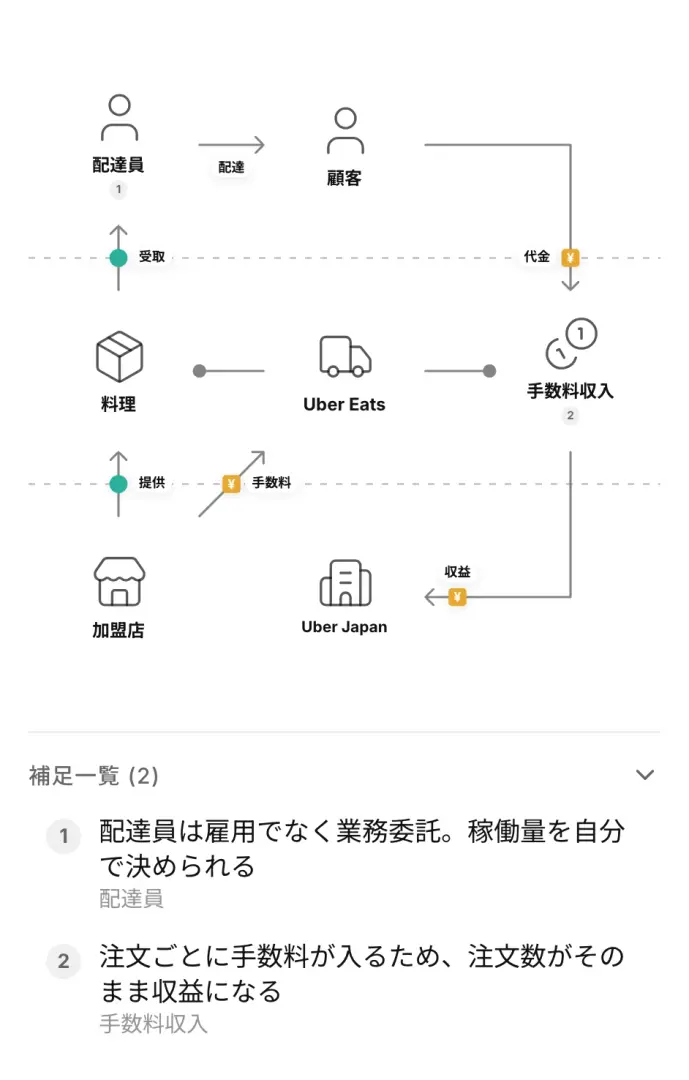
Notes carry important information that players and arrows cannot show, such as why a player is there or why an arrow exists. A note can have a note of its own.
How to read
Start with the middle column
(1) For whom? Who is the business for?
(2) What? What is done as the business? It may be a product.
(3) By whom? Who runs the business?
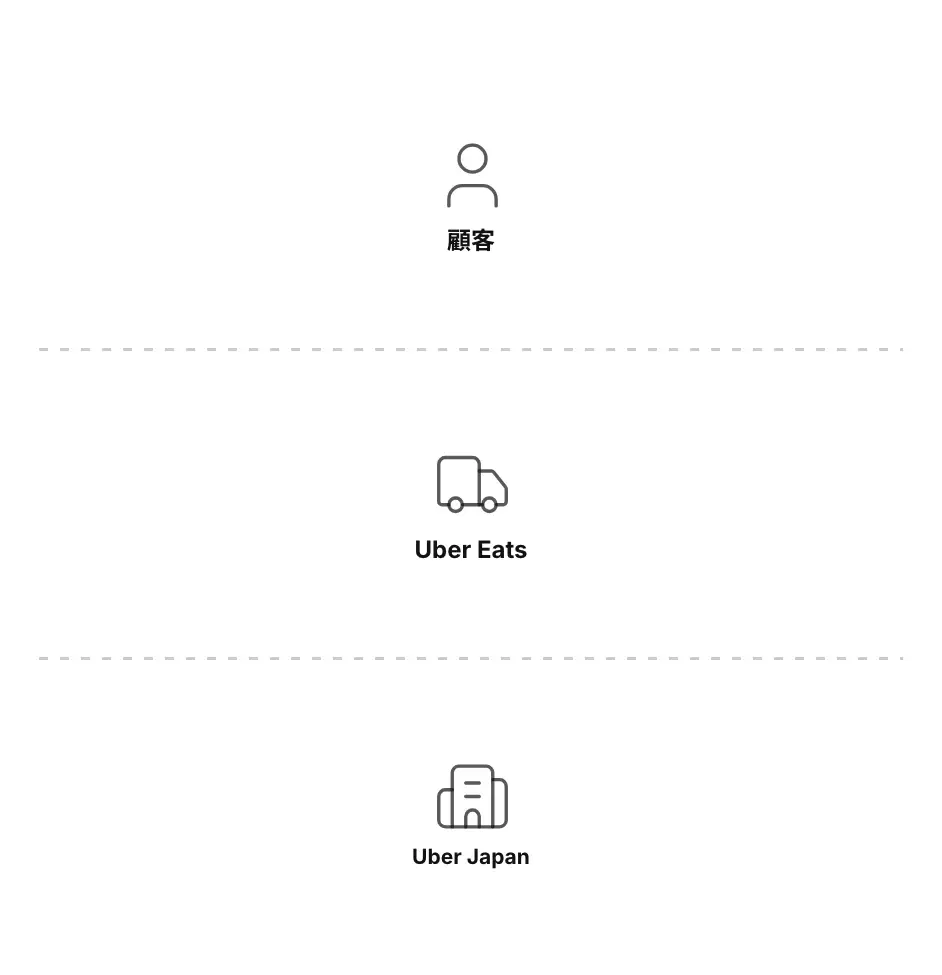
How to read
Then the middle row
(4) What are users paying for? What do they find valuable enough to pay for?
(5) Why does this business work? What resources or mechanisms does it rely on? It may be a source of earnings, such as fee income.
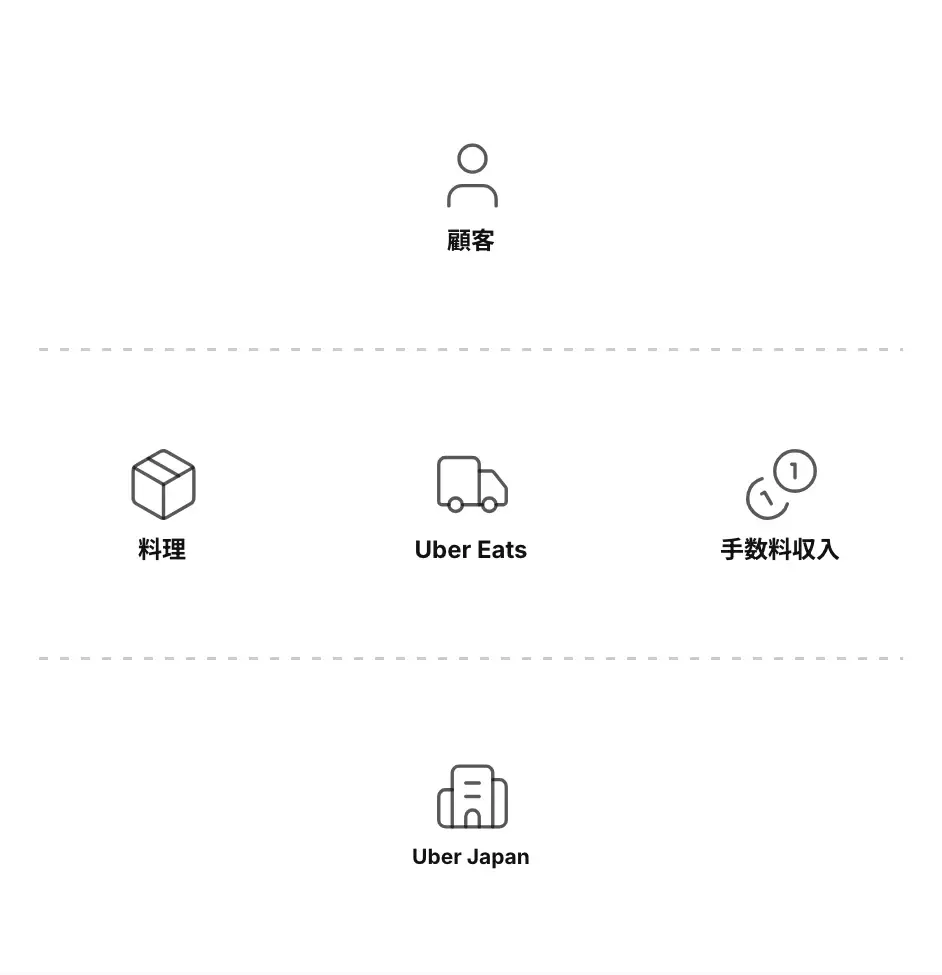
How to read
Then the corners
(6) Who else is involved? Are there partner companies or key affiliates?
(7) Who else is involved? Besides the users, are there other key people or companies?
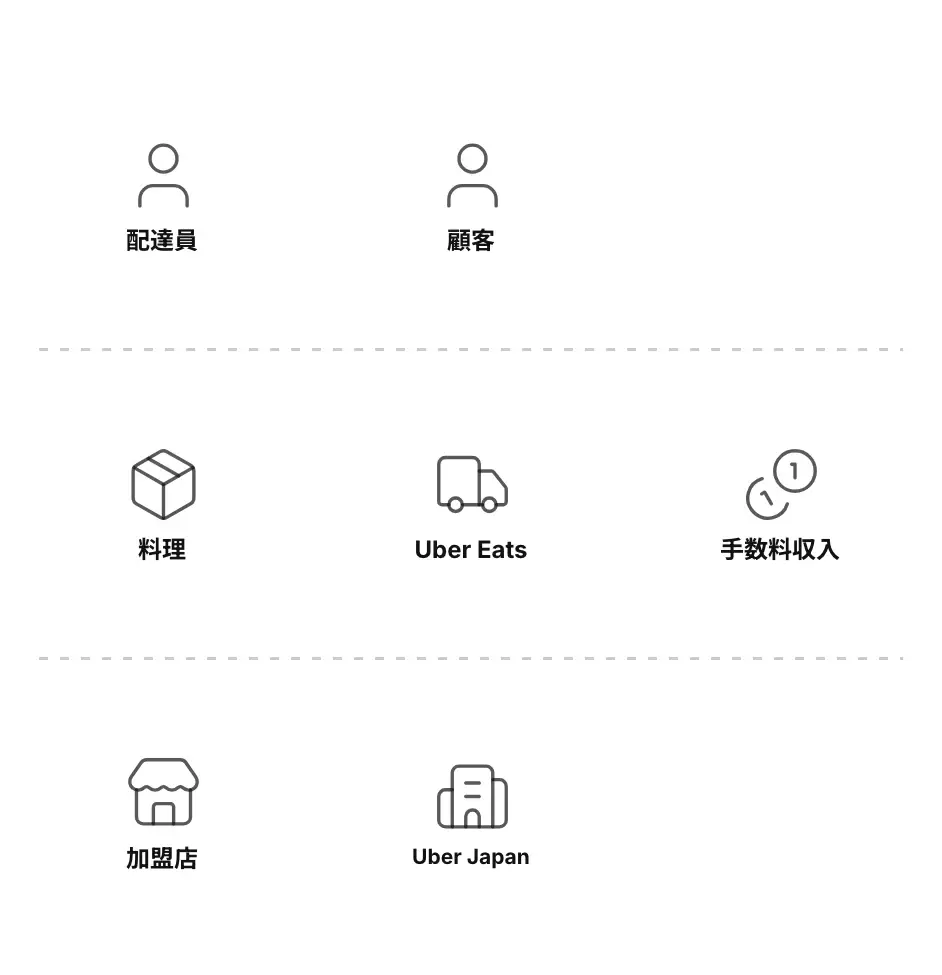
How to read
Finally, the arrows and notes
(8) What flows are there? How do goods, money and information flow?
Not every cell of the 3×3 grid has to be filled. In this example, the top right and bottom right are empty.
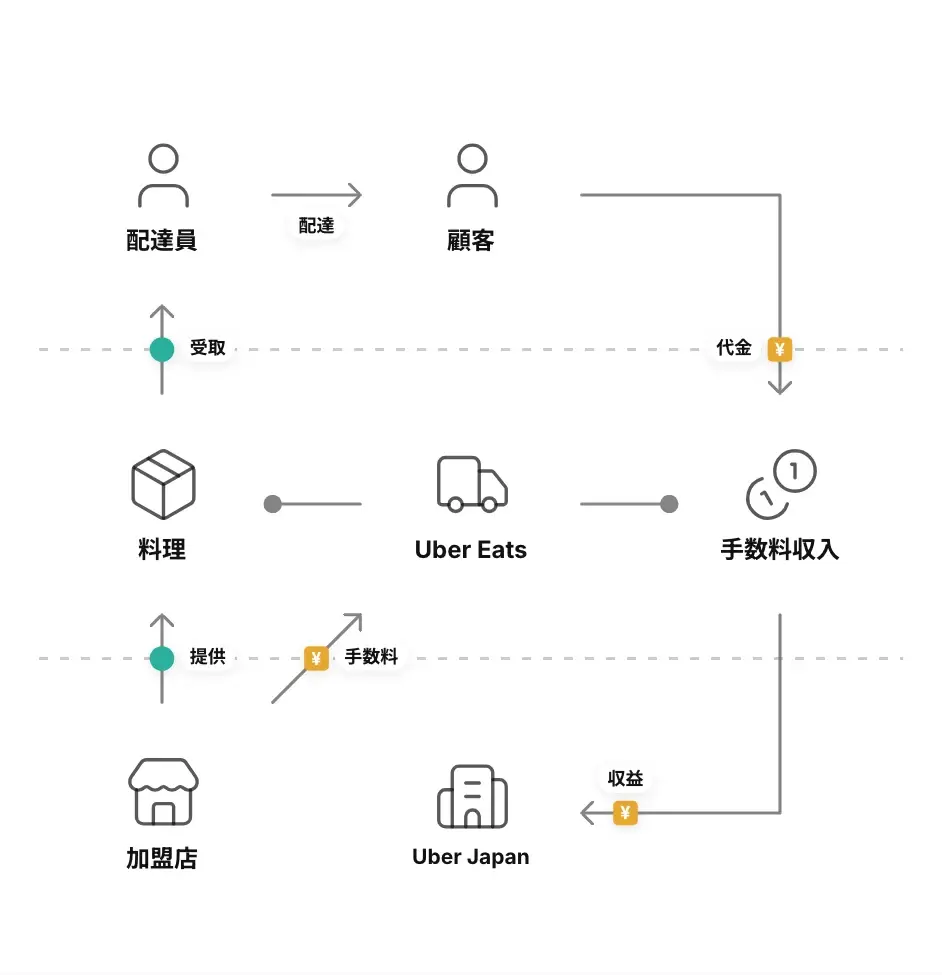
Who uses it
- leaders who explain their business inside and outside the company
- HR and training staff building young employees' understanding of the business
The toolkit has been downloaded more than 30,000 times and is used by many companies and organisations. It has also been used in workshops at the Cabinet Office and Nikkei, and in high school and university classes.
Use it as an app
Bizgram
A web tool where anyone can draw the business model of any venture in the same format, using a 3×3 grid and arrows. A gallery of worked examples is free to browse.
Try Bizgram ↗Get the toolkit

ビズグラムツールキット3.0From ¥1,650
A printed and slide set of Bizgram, ready to use in a workshop. Sold in our shop.
See it in the shop ↗Related projects
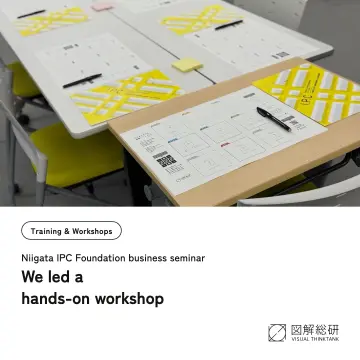 Business Model 3.0 hands-on workshop at the Niigata IPC Foundation
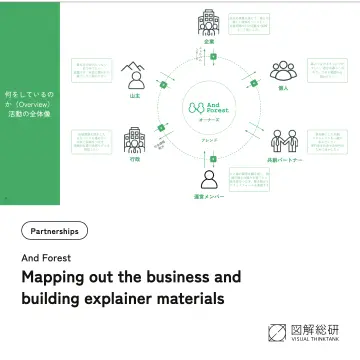 Mapping out And Forest's business and building explainer materials
 Supporting the Benesse business model analysis contest
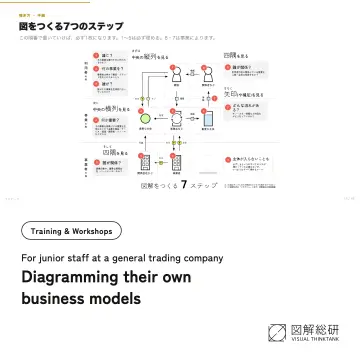 Business model diagram training for junior staff at a general trading company
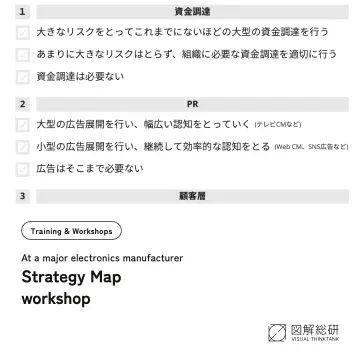 Strategy Map workshop at a major electronics manufacturer
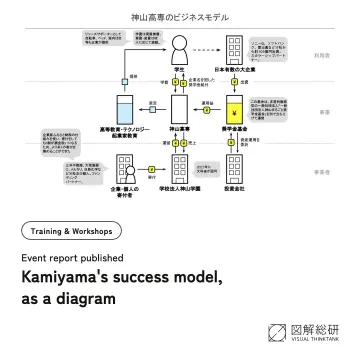 Reading two ventures in Kamiyama through business model diagrams
 Online course on Schoo: learning business models with diagrams
 Business model diagramming workshop at a general trading company
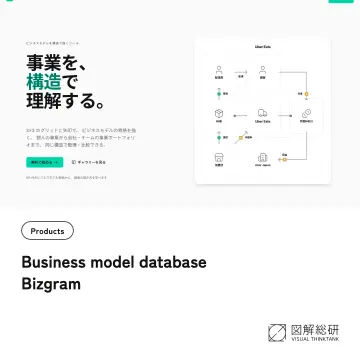 Bizgram, a business model database
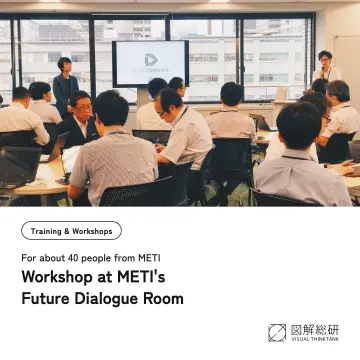 Workshop at METI's Future Dialogue Room
 Talk at Hakuhodo DY Holdings
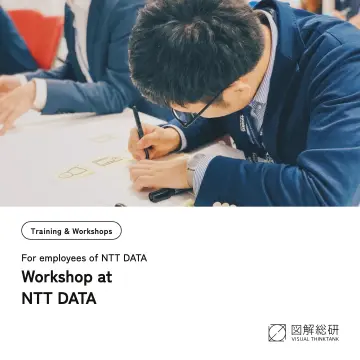 Workshop at NTT DATA
 Talk at Recruit Career
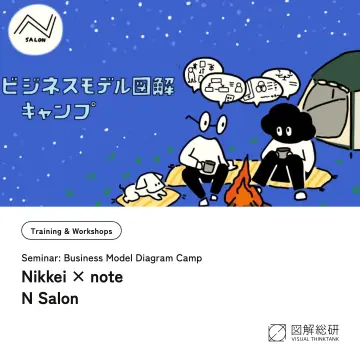 Nikkei × note N Salon
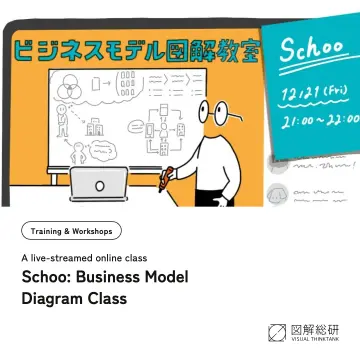 Schoo: Business Model Diagram Class
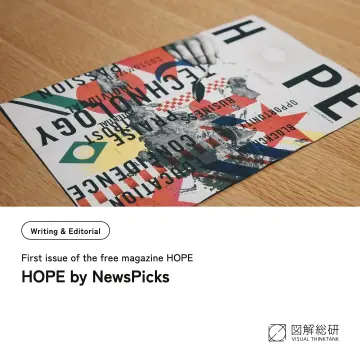 HOPE by NewsPicks
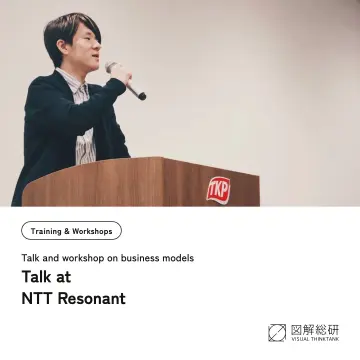 Talk and workshop at NTT Resonant
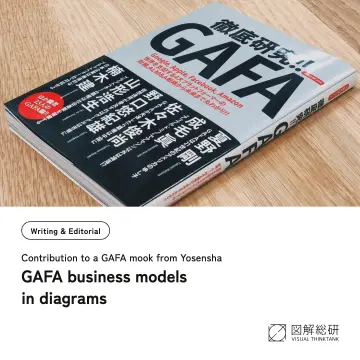 GAFA business models in diagrams
 Monthly Business Model Diagrams
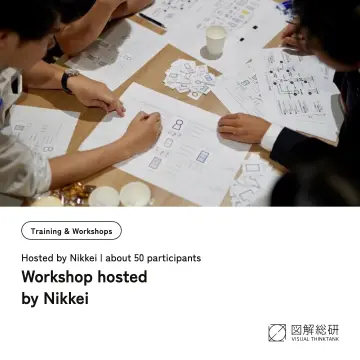 Workshop hosted by Nikkei
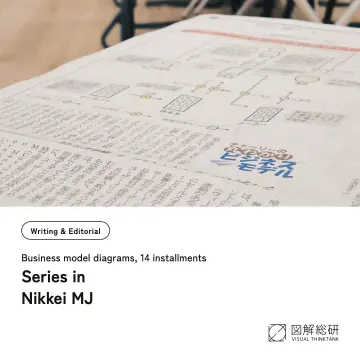 Series in Nikkei MJ
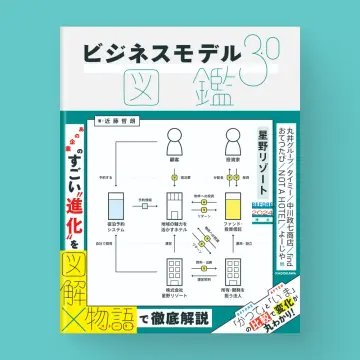
Read the book
How Bizgram Was Born
Business models are always being updated, new and agile. In these turbulent times, that tendency only grows stronger.
On the other hand, business models often involve information that does not become open; they rarely gather in one place, and it's hard to say transparency is high. Even as business-model transformation is so strongly demanded, business-model information is hard to reach—there is an information asymmetry.
Of course, there is highly confidential technical information and core management resources. But there are also ways to fulfill accountability to society by making business models explicit—showing how a company makes money and whether it does so at the expense of stakeholders.
To solve such problems, we classified business models into the four categories of people, things, money, and information, and made the profit structure and uniqueness of various companies and services visible as a “diagram” on a 3×3 grid of nine cells.
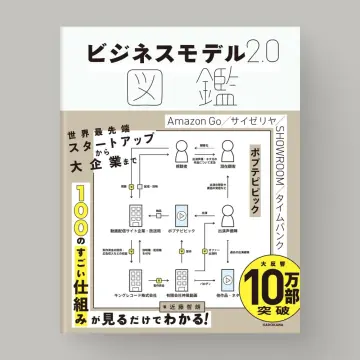
We also published “Business Model 2.0 Encyclopedia,” which compiled this diagramming method, from KADOKAWA in September 2018, to a major response.
“Business Model 2.0 Encyclopedia” has sold over 100,000 copies in Japan and is also on sale overseas (China, Taiwan, Korea). We have released a toolkit on the web so anyone can create business-model diagrams; it has been downloaded more than 30,000 times and the method is used by many companies and organizations. Search for “business model” and related articles appear at the top of results; the related articles we created have together exceeded 1.5 million views. In 2019, it won the GOOD DESIGN AWARD.
We also give lectures and workshops at companies and government offices—such as the Cabinet Office and Nikkei—as a tool for conceiving business models, and we have held classes for high schools and universities, mainly as entrepreneurship education.
News about this framework
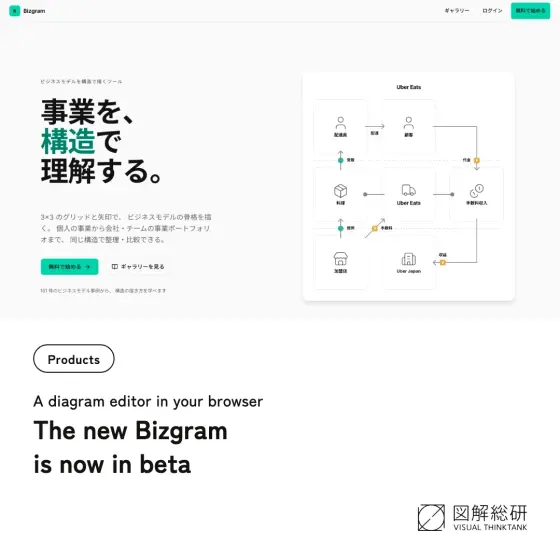 We've released the new Bizgram in betaNews2026/06/30
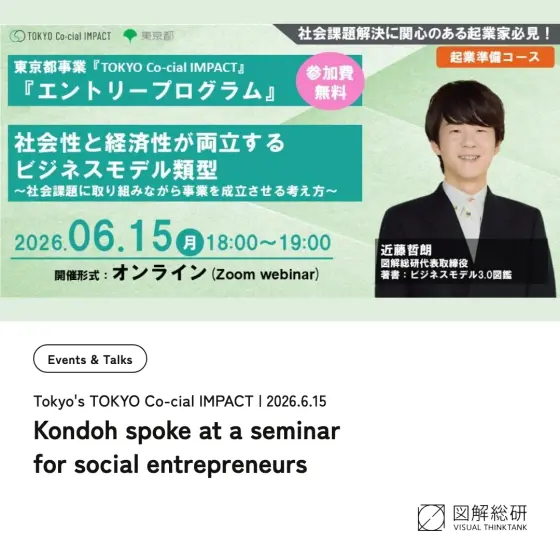 Our CEO spoke at a seminar for social entrepreneurs in Tokyo's "TOKYO Co-cial IMPACT" programNews2026/06/15
 Our CEO appeared on TOKYO FM's "ONE MORNING"News2026/04/14
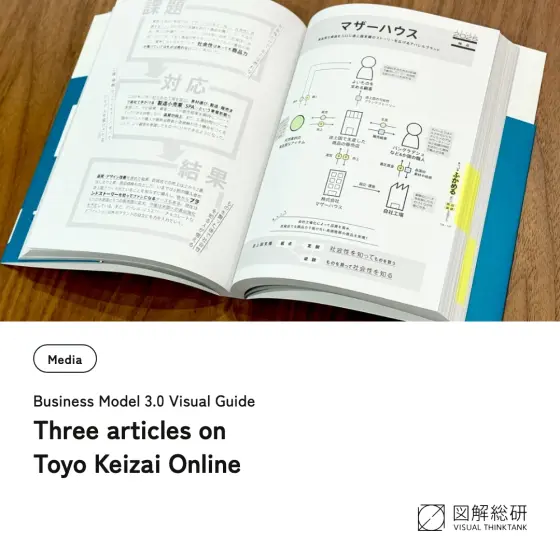 Three articles based on "Business Model 3.0 Visual Guide" have run on Toyo Keizai OnlineNews2026/03/03
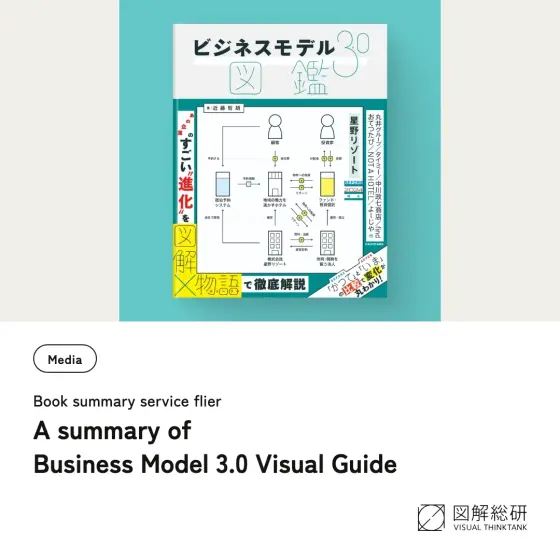 A summary of "Business Model 3.0 Visual Guide" is now on the book summary service flierNews2026/02/21
 We released Bizgram, a database of business modelsNews2021/09/21
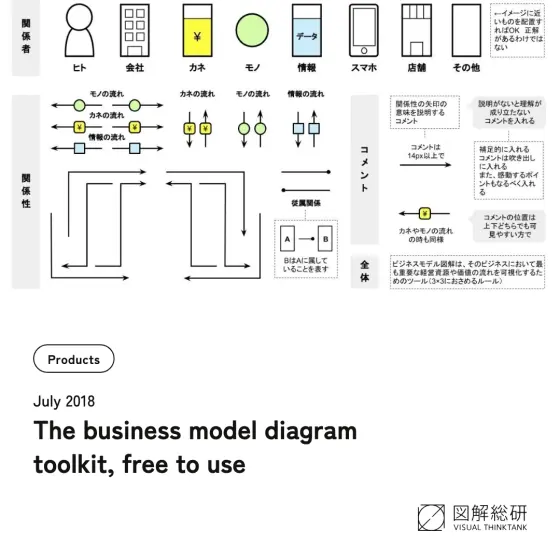 We released the business model diagram toolkit for freeNews2018/07/20
Contact
A problem you are stuck on, a project you are considering, a press inquiry. We also take inquiries that have not taken shape yet.
Talk to us