Overview
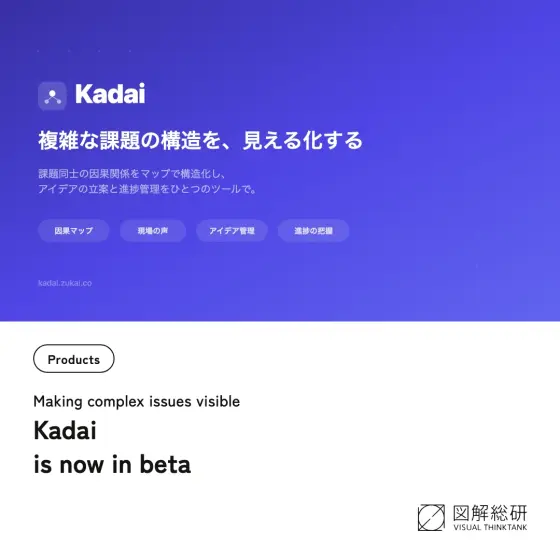
Kadai is a web app that supports problem-solving for local governments, companies, and NPOs. Visualizing the structure of complex issues, gathering voices from the field, devising solutions, and managing progress—it supports the entire problem-solving process with a single tool.
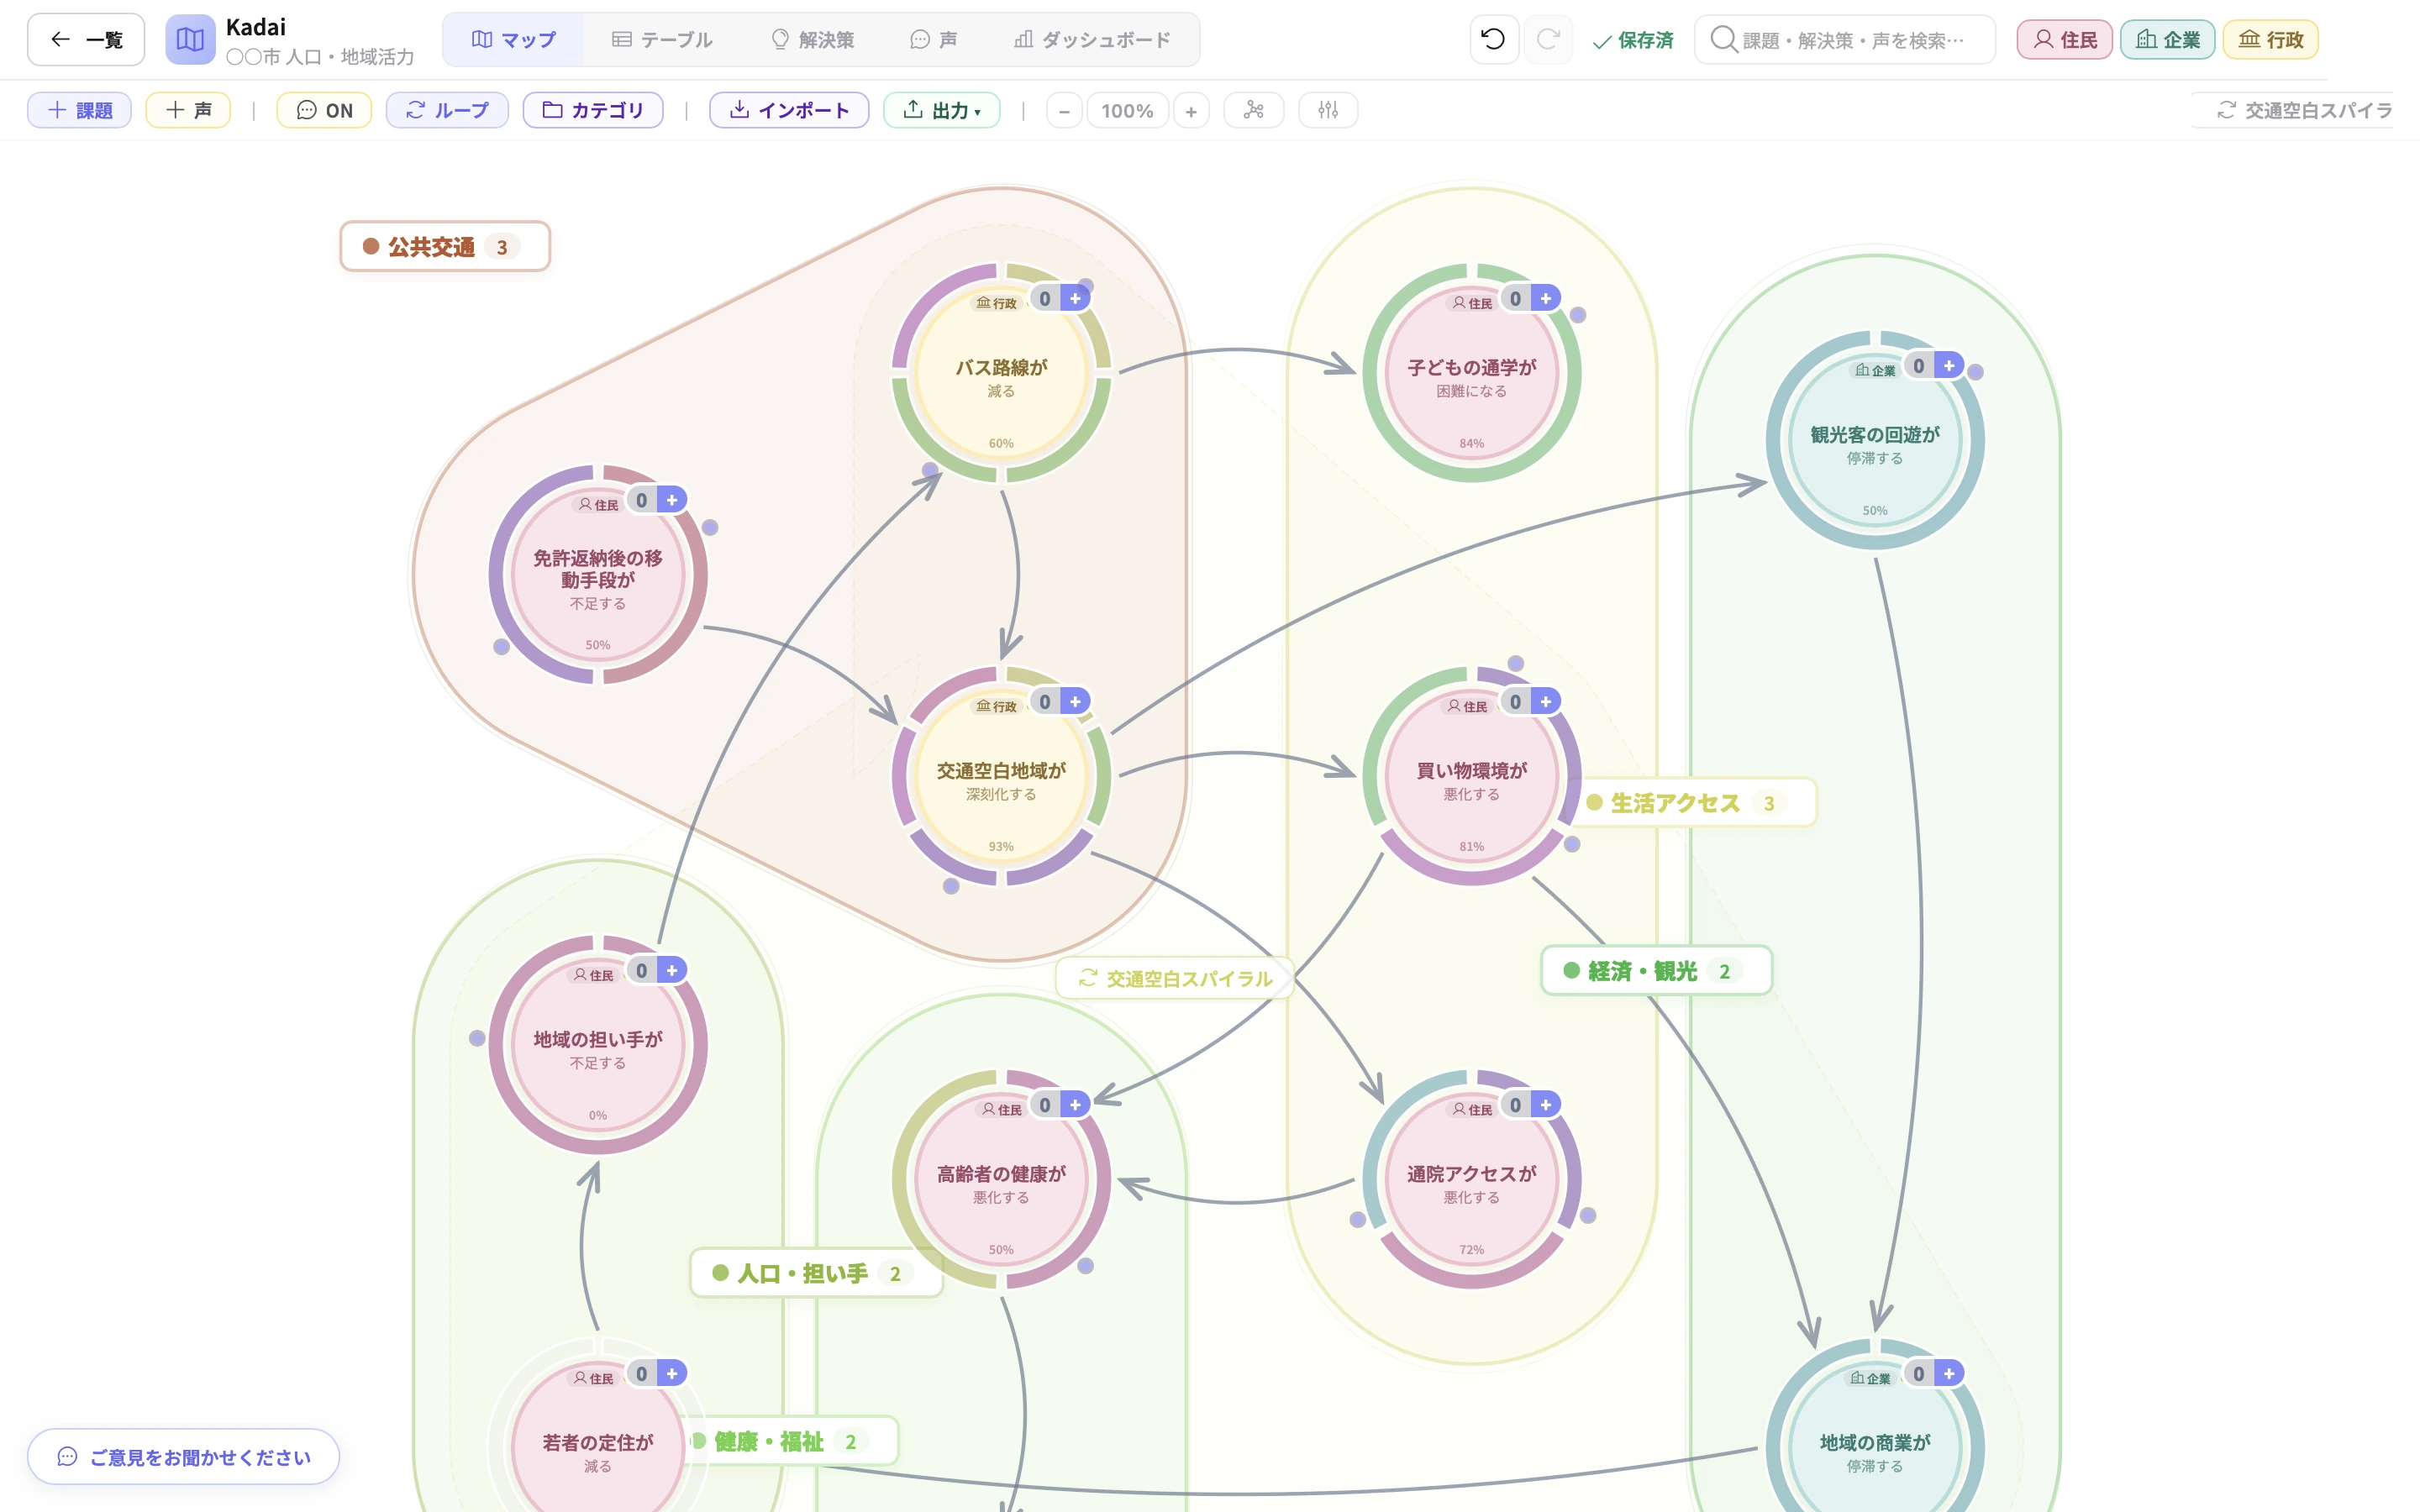
Regional issues, social issues, organizational issues. They rarely exist on their own. One issue triggers another, which in turn leads to yet another problem. For example, "bus routes are reduced" → "transit-deprived areas become more serious" → "the shopping environment deteriorates" → "the health of the elderly declines"… In this way, issues become complexly intertwined, and it becomes impossible to see where to start. This is the reality facing many local governments, companies, and communities.
That is why ZUKAI has systematized the know-how of "structurally visualizing issues" that we have cultivated across many projects.
Background of Development
Kadai was born from a question: how far can we reproduce, as a tool, the tacit knowledge of issue visualization that ZUKAI has cultivated through its past projects?
ZUKAI has worked on many "issue maps" that connect regional and social issues through causal relationships and capture them in a single picture, in collaboration with foundations and diverse stakeholders. We identify issues through workshops with residents and experts, then bundle and structure them. We link issues with solutions and connect them to small, resident-driven experiments (micro-projects).
The know-how accumulated through this series of processes is condensed into Kadai.
It is currently at the prototype stage. We are taking an experimental approach of developing it solely through dialogue with generative AI, making updates day by day. We will announce the official release separately.
What You Can Do with Kadai
◼︎Visualize causal relationships between issues with a "map"
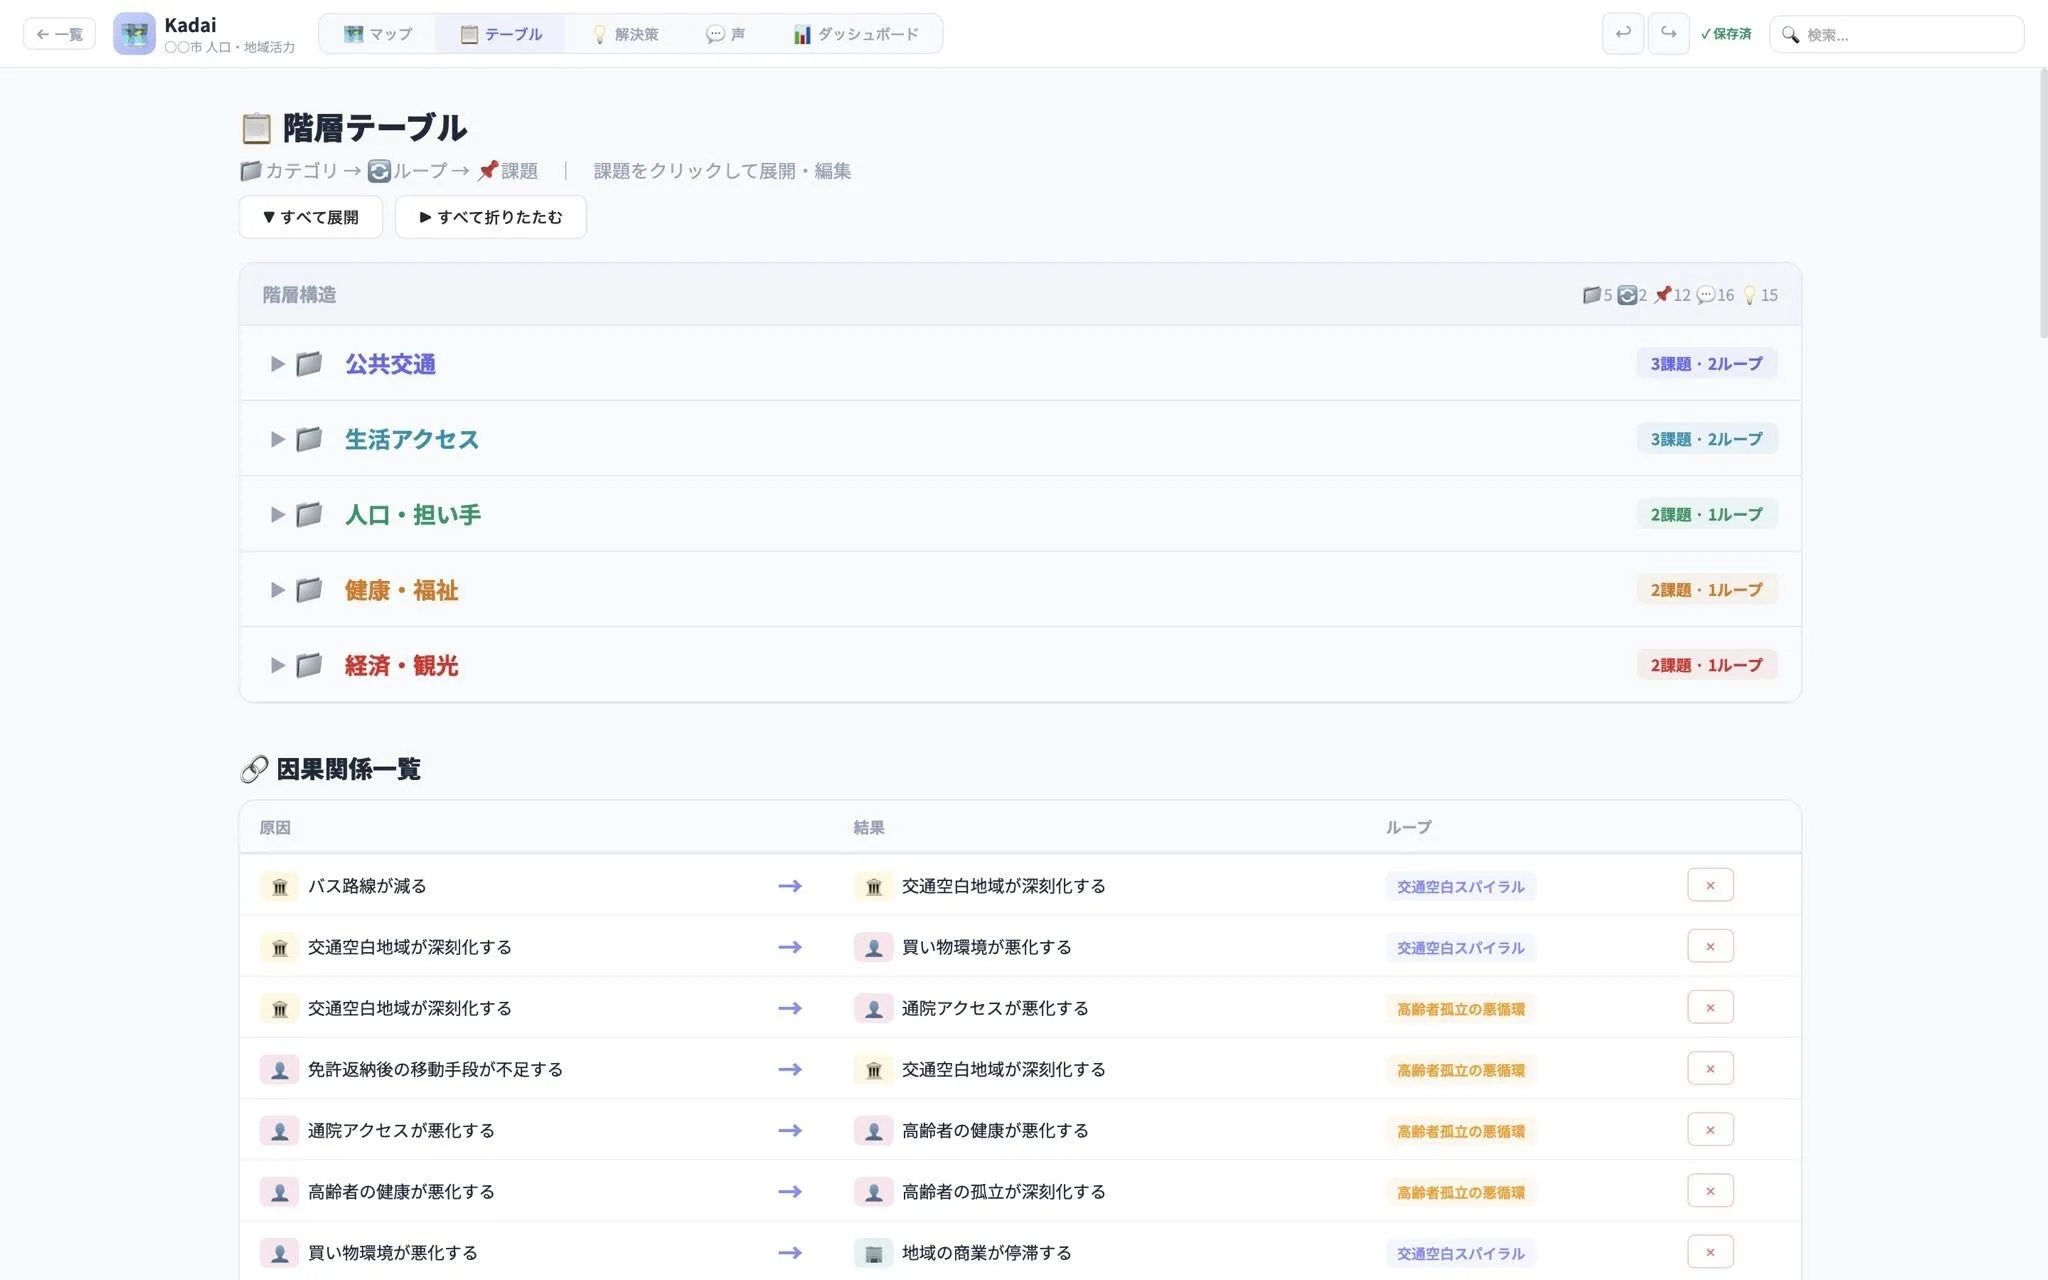
◼︎Organize issues in a table format
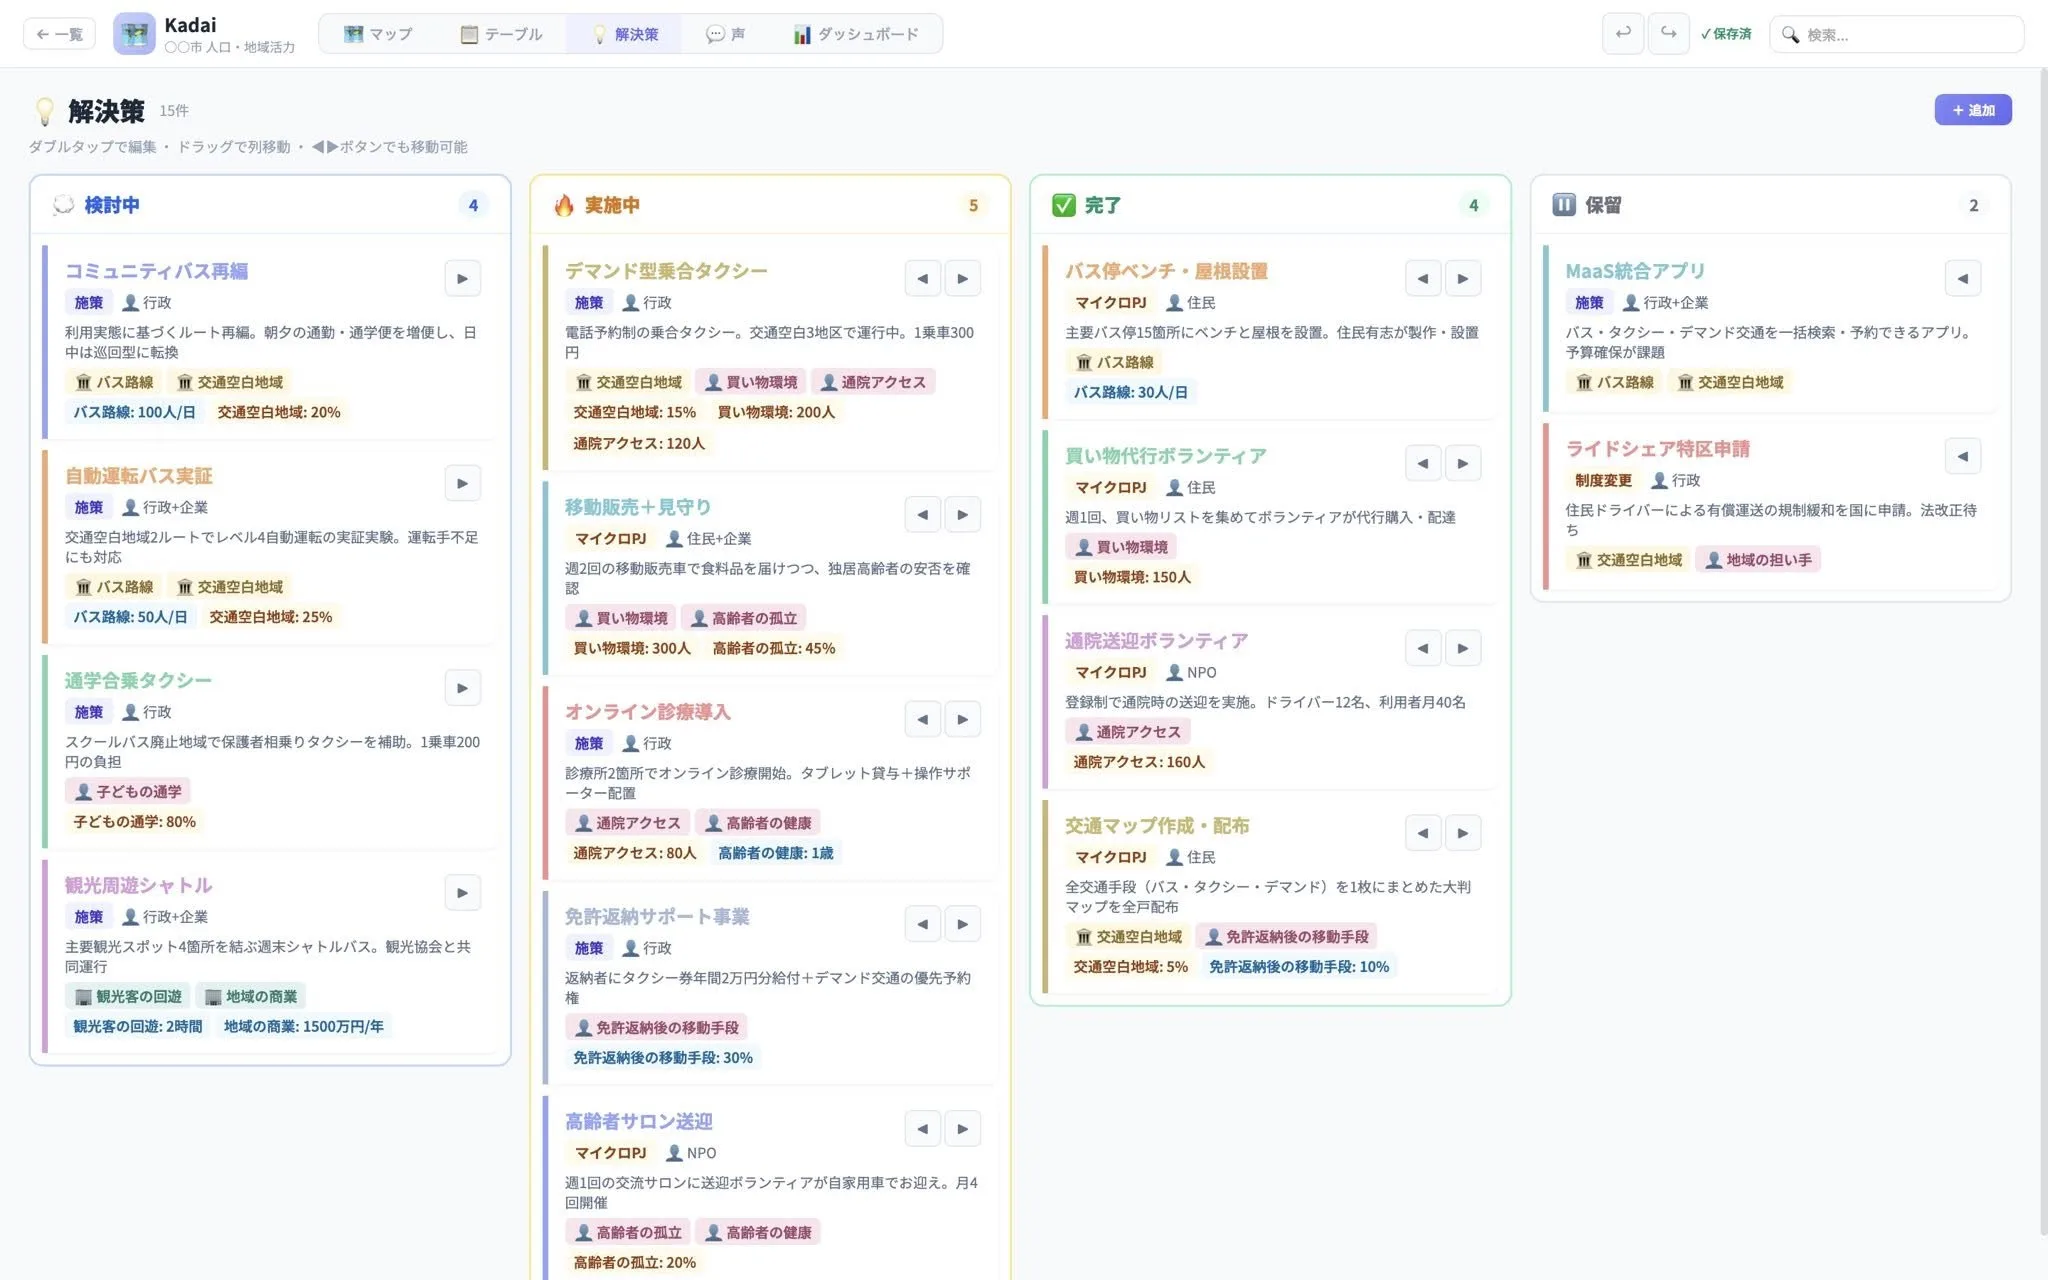
◼︎Manage the progress of solutions
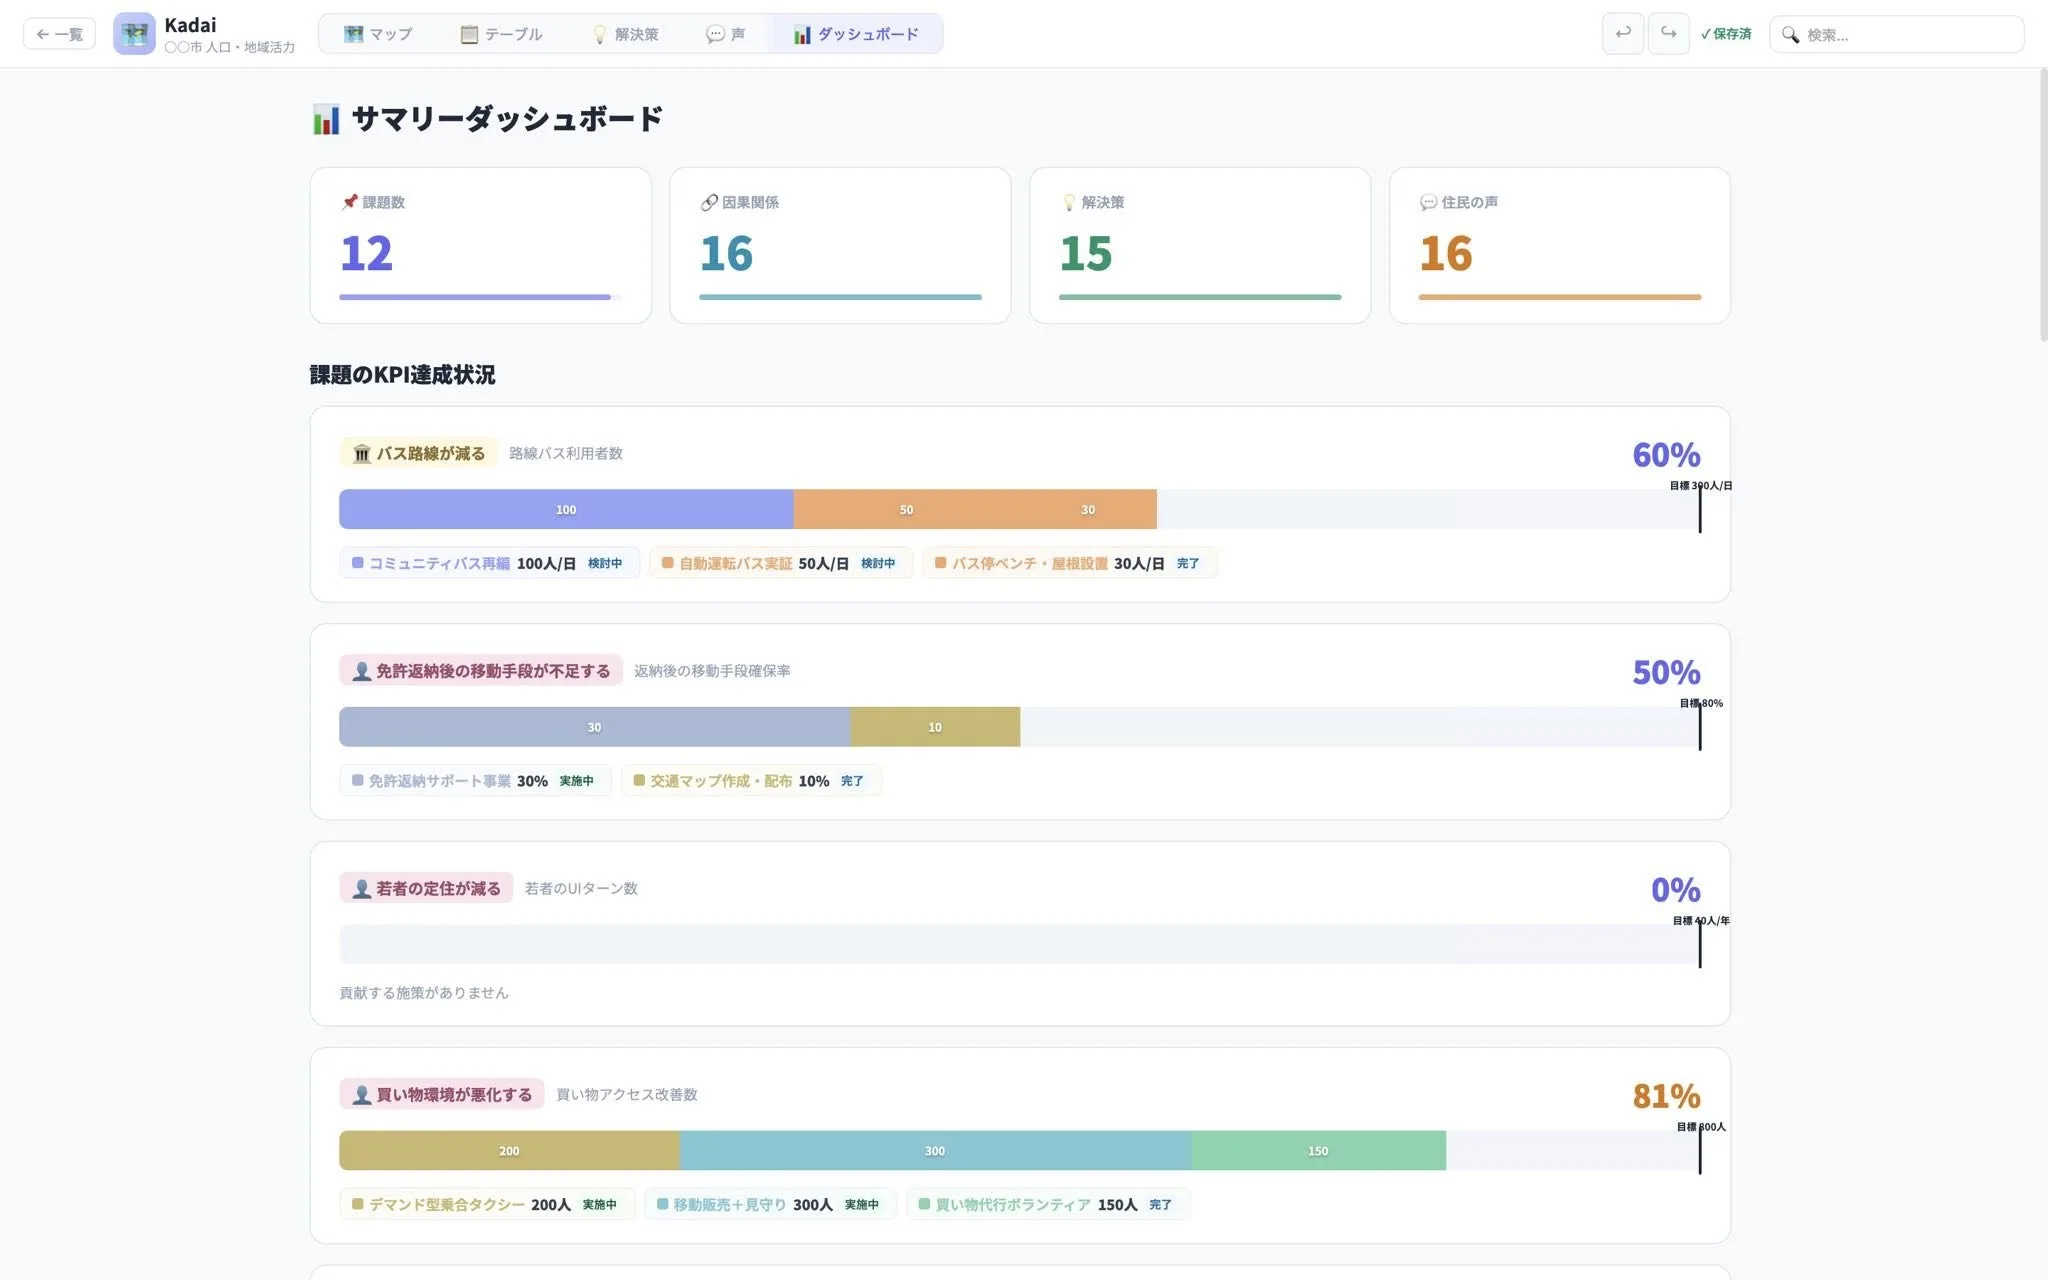
◼︎Track KPI achievement status on a dashboard
Useful in Situations Like These
◼︎Issues are complexly intertwined and the overall picture is unclear
◼︎You want to share and organize issues across a team or organization
◼︎You want to centrally manage the progress of solutions and KPIs
etc.
App Information
App name: Kadai
Supported environment: Web
Status: Prototype (in development)
Language: Japanese
Developers: Tetsuro Kondoh, Makoto Okiyama